Foundations of Finance (9th Edition) (Pearson Series in Finance)
9th Edition
ISBN: 9780134083285
Author: Arthur J. Keown, John D. Martin, J. William Petty
Publisher: PEARSON
expand_more
expand_more
format_list_bulleted
Concept explainers
Videos
Textbook Question
Chapter 6, Problem 2SP
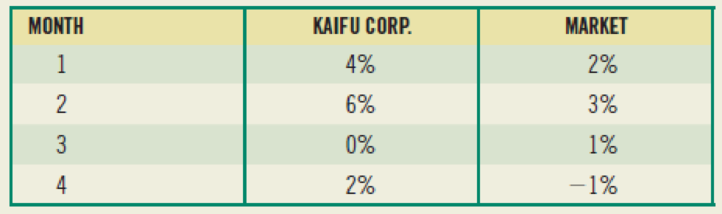
(Average expected return and risk) Given the holding-period returns shown here, calculate the average returns and the standard deviations for the Kaifu Corporation and for the market.
Expert Solution & Answer
Want to see the full answer?
Check out a sample textbook solution
Students have asked these similar questions
An investment Analysist provide the following data regarding the possible future returns on AmDa’s common stock
State of economy Probability ReturnRecession 0.25 -1.4%Normal 0.45 9.4%Boom 0.30 15.4%i. Compute the expected return on the security?
ii. Compute the standard deviation on the security?
iii. Compute the Coefficient of variation
When working with the CAPM, which of the following factors can be determined with the most precision?
a. The beta coefficient of "the market," which is the same as the beta of an average stock.
b. The beta coefficient, bi, of a relatively safe stock.
c. The market risk premium (RPM).
d. The most appropriate risk-free rate, rRF.
e. The expected rate of return on the market, rM.
When working with the CAPM, which of the following factors can be determined with the most precision?
a. The most appropriate risk-free rate, rRF.
b. The market risk premium (RPM).
c. The beta coefficient, bi, of a relatively safe stock.
d. The expected rate of return on the market, rM.
e. The beta coefficient of "the market," which is the same as the beta of an average stock.
Chapter 6 Solutions
Foundations of Finance (9th Edition) (Pearson Series in Finance)
Ch. 6 - a. What is meant by the investors required rate of...Ch. 6 - Prob. 2RQCh. 6 - What is a beta? How is it used to calculate r, the...Ch. 6 - Prob. 4RQCh. 6 - Prob. 5RQCh. 6 - Prob. 6RQCh. 6 - Prob. 7RQCh. 6 - What effect will diversifying your portfolio have...Ch. 6 - (Expected return and risk) Universal Corporation...Ch. 6 - (Average expected return and risk) Given the...
Ch. 6 - (Expected rate of return and risk) Carter, Inc. is...Ch. 6 - (Expected rate of return and risk) Summerville,...Ch. 6 - Prob. 5SPCh. 6 - Prob. 9SPCh. 6 - Prob. 10SPCh. 6 - Prob. 11SPCh. 6 - Prob. 12SPCh. 6 - (Capital asset pricing model) Using the CAPM,...Ch. 6 - Prob. 16SPCh. 6 - Prob. 17SPCh. 6 - a. Compute an appropriate rate of return for Intel...Ch. 6 - (Estimating beta) From the graph in the right...Ch. 6 - Prob. 20SPCh. 6 - Prob. 21SPCh. 6 - (Capital asset pricing model) The expected return...Ch. 6 - (Portfolio beta and security market line) You own...Ch. 6 - (Portfolio beta) Assume you have the following...Ch. 6 - Prob. 1MCCh. 6 - Prob. 2MCCh. 6 - Prob. 3MCCh. 6 - Prob. 4MCCh. 6 - Prob. 5MCCh. 6 - Prob. 6MCCh. 6 - Prob. 7MCCh. 6 - Prob. 8MCCh. 6 - Prob. 9MCCh. 6 - Prob. 10MCCh. 6 - Prob. 11MC
Knowledge Booster


Learn more about
Need a deep-dive on the concept behind this application? Look no further. Learn more about this topic, finance and related others by exploring similar questions and additional content below.Similar questions
- Calculate the correlation coefficient between Blandy and the market. Use this and the previously calculated (or given) standard deviations of Blandy and the market to estimate Blandy’s beta. Does Blandy contribute more or less risk to a well-diversified portfolio than does the average stock? Use the SML to estimate Blandy’s required return.arrow_forwardThe file Fortune500 contains data for profits and market capitalizations from a recent sample of firms in the Fortune 500 a. Prepare a scatter diagram to show the relationship between the variables Market Capitalization and Profit in which Market Capitalization is on the vertical axis and Profit is on the horizontal axis. Comment on any relationship between the variables. b. Create a trendline for the relationship between Market Capitalization and Profit. What does the trendline indicate about this relationship?arrow_forwardIn a CAPM world, what do you need to know in order to estimate an asset's expected return? Group of answer choices The risk free rate, the market risk premium, and the asset's standard deviation The risk free rate, the market risk premium, and the asset's beta The corporate bond rate, the expected return on the S&P 500 and the asset's Beta Market sentiment, historical stock returns and the risk free ratearrow_forward
- Use the following information on states of the economy and stock returns to calculate the expected return for Dingaling Telephone:arrow_forwardWhat is a characteristic line? How is this line usedto estimate a stock’s beta coefficient? Write outand explain the formula that relates total risk,market risk, and diversifiable riskarrow_forwardAssume that the expected return and standard deviation of the company stock will be 17 percent, respectively. How appropriate is the sharpe ratio for these assets? When would you use the sharpe ratio?arrow_forward
- Suppose you have the following expectations about the market condition and the returns on Stocks X and Y. a) What are the expected returns for Stocks X and Y, E(rX) and E(rY)? b) What are the standard deviations of the returns for Stocks X and Y, σX and σY?arrow_forwardThe metric that is used to show the extent to which a given stock’s return move up and down with the stock market? a. Correlation b. Beta c. Standard deviation d. Expected returnarrow_forwardThe following four macro-economic factors were identified regarding a stock As returns, the stock sensitivity to each factor and the related risk premium associated with each factor have been calculated as follows: Gross domestic product (GDP) growth=0.6 RP=4% Inflation rate= 0.8, RP=2% Platinum prices=-0.7, RP= 5% Standard and Poor’s 500 index return= 1.3 RP=9% The risk free rate is 3% Calculate the expected rate of return using the Arbitrage pricing theory formula.arrow_forward
- Which of the following statements is INCORRECT? A stock's beta is calculated as the covariance between the stock's price and the market portfolio return, divided by the variance of the market portfolio return. If we assume that the market portfolio (or the S&P 500) is efficient, then changes in the value of the market portfolio represent systematic shocks to the economy. The risk premium investors can earn by holding the market portfolio is the difference between the market portfolio's expected return and the risk-free interest rate. A stock’s standard deviation is a measure of the total risk.arrow_forwardIn historical data, we see that investments with the highest average annual returns also tend to have the highest standard deviations of annual returns. This observation supports the notion that there is a positive correlation between risk and return. Which of the following answers correctly ranks investments from highest to lowest risk (and return), where the security with the highest risk is shown first, the one with the lowest risk last? a. Large-company stocks, small-company stocks, long-term corporate bonds, U.S. Treasury bills, long-term government bonds. b. Small-company stocks, large-company stocks, long-term corporate bonds, long-term government bonds, U.S. Treasury bills. c. U.S. Treasury bills, long-term government bonds, long-term corporate bonds, small-company stocks, large-company stocks. d. Large-company stocks, small-company stocks, long-term corporate bonds, long-term government bonds, U.S. Treasury bills. e. Small-company stocks, long-term corporate bonds,…arrow_forwardThe market and Stock A have the following probability distributions: Probability Return on market Return on Stock A 0.2 18% 16% 0.3 12% 14% 0.5 10% 11% Calculate the expected rates of return for the market and Stock A. Calculate the coefficient of variation for the market and Stock A (Standard deviation for market is 3.0265% and standard deviation for Stock A is 2.0224%).arrow_forward
arrow_back_ios
SEE MORE QUESTIONS
arrow_forward_ios
Recommended textbooks for you
 EBK CONTEMPORARY FINANCIAL MANAGEMENTFinanceISBN:9781337514835Author:MOYERPublisher:CENGAGE LEARNING - CONSIGNMENT
 Intermediate Financial Management (MindTap Course...FinanceISBN:9781337395083Author:Eugene F. Brigham, Phillip R. DavesPublisher:Cengage Learning
 Essentials of Business Analytics (MindTap Course ...StatisticsISBN:9781305627734Author:Jeffrey D. Camm, James J. Cochran, Michael J. Fry, Jeffrey W. Ohlmann, David R. AndersonPublisher:Cengage Learning
EBK CONTEMPORARY FINANCIAL MANAGEMENT
Finance
ISBN:9781337514835
Author:MOYER
Publisher:CENGAGE LEARNING - CONSIGNMENT
Intermediate Financial Management (MindTap Course...
Finance
ISBN:9781337395083
Author:Eugene F. Brigham, Phillip R. Daves
Publisher:Cengage Learning
Essentials of Business Analytics (MindTap Course ...
Statistics
ISBN:9781305627734
Author:Jeffrey D. Camm, James J. Cochran, Michael J. Fry, Jeffrey W. Ohlmann, David R. Anderson
Publisher:Cengage Learning
Portfolio Management; Author: DevTechFinance;https://www.youtube.com/watch?v=Qmw15cG2Mv4;License: Standard YouTube License, CC-BY