
Concept explainers
Videos
a.
Find the percentage of the students who have done their homework and attended lectures will obtain a grade of A on this multiple-choice examination.
a.
Answer to Problem 49SE
The percentage of the students who have done their homework and attended lectures will obtain a grade of A on this multiple-choice examination is about 5.113%.
Explanation of Solution
Calculation:
The examination contains 50 multiple choice questions. Each question has four options. The students have 75% probability to answer any question correctly if they attend lecture and do homework.
Here, the student must answer correctly to 43 questions to obtain grade A.
The formula for mean in binomial distribution is,
The value of mean is,
The formula for standard deviation is,
The value of standard deviation is,
Continuity correction:
The binomial probability is converted to a
If the binomial probability represents “more than c” then the normal probability is
By using continuity correction, the value 0.5 is subtracted from 43.
That is,
Thus, the binomial probability to a normal probability by using continuity correction is
Software Procedure:
Step-by-step procedure to obtain the probability value using the MINITAB software:
- Choose Graph > Probability Distribution Plot choose View Probability > OK.
- Enter the Mean as 37.5 and Standard deviation as 3.06.
- From Distribution, choose ‘Normal’ distribution.
- Click the Shaded Area tab.
- Choose X Value and Right Tail for the region of the curve to shade.
- Enter the X value as 42.5.
- Click OK.
Output using the MINITAB software is given below:
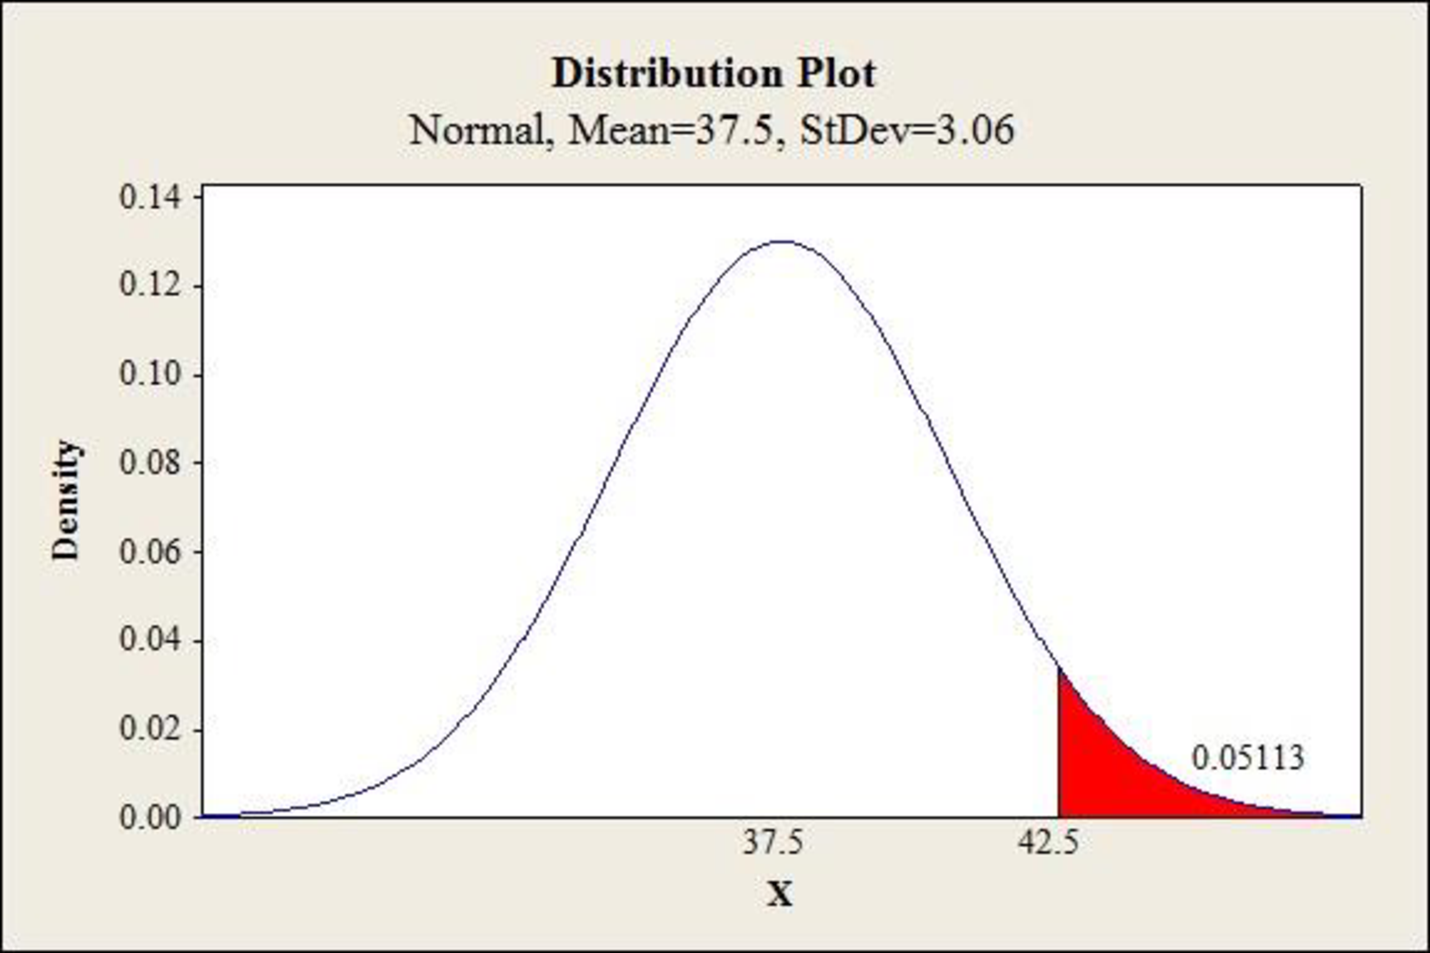
From the graph, the probability value is 0.05113.
Thus, the percentage of the students is 5.113%.
b.
Find the percentage of the students who have done their homework and attended lectures will obtain a grade of C on this multiple-choice examination.
b.
Answer to Problem 49SE
The percentage of the students who have done their homework and attended lectures will obtain a grade of C on this multiple-choice examination is 57.99%.
Explanation of Solution
Calculation:
Here, the student must answer correctly to 35 to 39 questions to obtain grade C.
If the binomial probability represents “between than
By using continuity correction, the value 0.5 is subtracted from 35 and the value 0.5 added to 39.
That is,
Thus, the binomial probability to a normal probability by using continuity correction is
Software Procedure:
Step-by-step procedure to obtain the probability value using the MINITAB software:
- Choose Graph > Probability Distribution Plot choose View Probability > OK.
- Enter the Mean as 37.5 and Standard deviation as 3.06.
- From Distribution, choose ‘Normal’ distribution.
- Click the Shaded Area tab.
- Choose X Value and Middle Tail for the region of the curve to shade.
- Enter the X value 1 as 34.5 and X value 2 as 39.5.
- Click OK.
Output using the MINITAB software is given below:
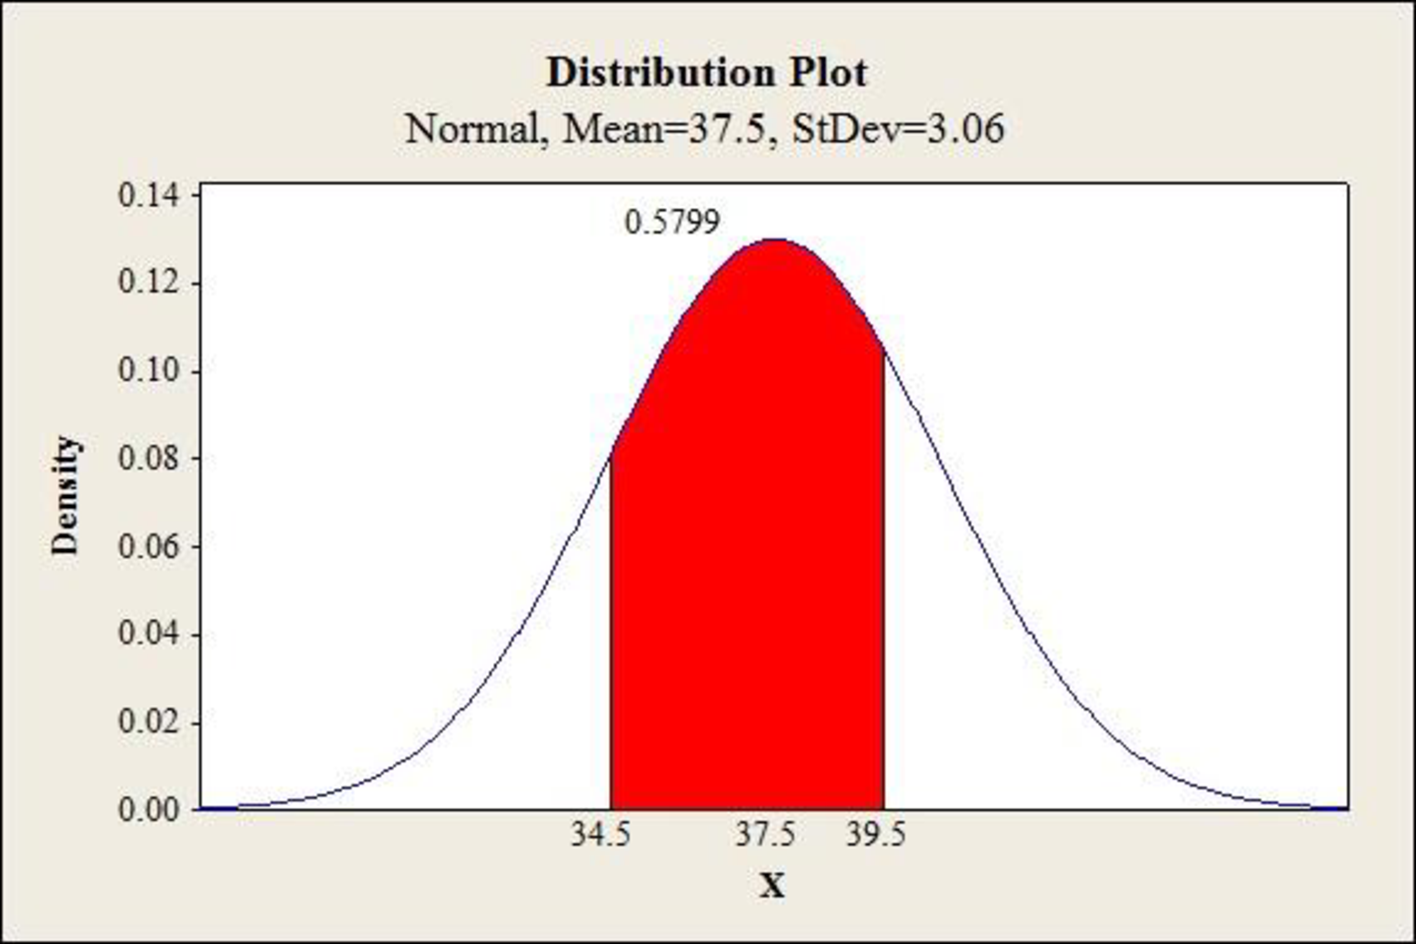
From the graph, the probability value is 0.5799
Thus, the percentage of the students is 57.99%.
c.
Find the percentage of the students who have done their homework and attended lectures will pass the examination.
c.
Answer to Problem 49SE
The percentage of the students who have done their homework and attended lectures will pass the examination is about 99.55%.
Explanation of Solution
Calculation:
Here, the student must answer correctly to 30 or more questions to pass the examination.
If the binomial probability represents “more than c” then the normal probability is
By using continuity correction, the value 0.5 is subtracted from 30.
That is,
Thus, the binomial probability to a normal probability by using continuity correction is
Software Procedure:
Step-by-step procedure to obtain the probability value using the MINITAB software:
- Choose Graph > Probability Distribution Plot choose View Probability > OK.
- Enter the Mean as 37.5 and Standard deviation as 3.06.
- From Distribution, choose ‘Normal’ distribution.
- Click the Shaded Area tab.
- Choose X Value and Right Tail for the region of the curve to shade.
- Enter the X value as 29.5.
- Click OK.
Output using the MINITAB software is given below:
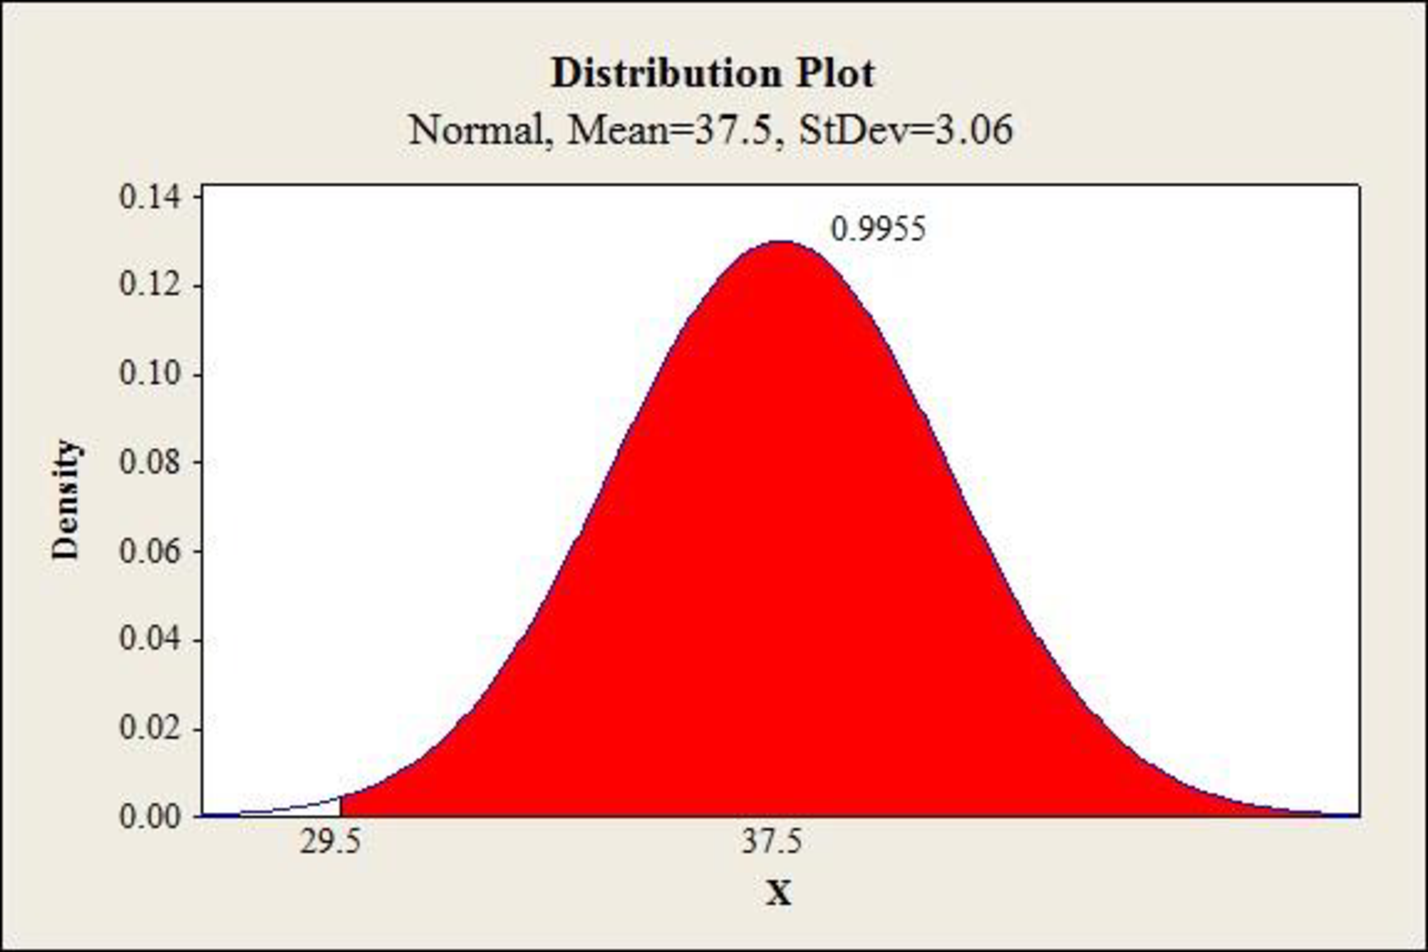
From the graph, the probability value is 0.9955.
Thus, the percentage of the students is 99.55%.
d.
Find the probability that the students who did not attend the classes and not done the homework will answer 30 or more questions correctly on the multiple choice examinations.
d.
Answer to Problem 49SE
The students who did not attend the classes and not done the homework will not pass the examination by guess.
Explanation of Solution
Calculation:
Here, the student did not attend the class and has not done the homework.
Approximately 25% students of did not attend the classes and not done the homework.
The value of mean is,
The value of standard deviation is,
If the binomial probability represents “more than c” then the normal probability is
By using continuity correction, the value 0.5 is subtracted from 30.
That is,
Thus, the binomial probability to a normal probability by using continuity correction is
Software Procedure:
Step-by-step procedure to obtain the probability value using the MINITAB software:
- Choose Graph > Probability Distribution Plot choose View Probability > OK.
- Enter the Mean as 12.5 and Standard deviation as 3.06.
- From Distribution, choose ‘Normal’ distribution.
- Click the Shaded Area tab.
- Choose X Value and Right Tail for the region of the curve to shade.
- Enter the X value as 29.5.
- Click OK.
Output using the MINITAB software is given below:
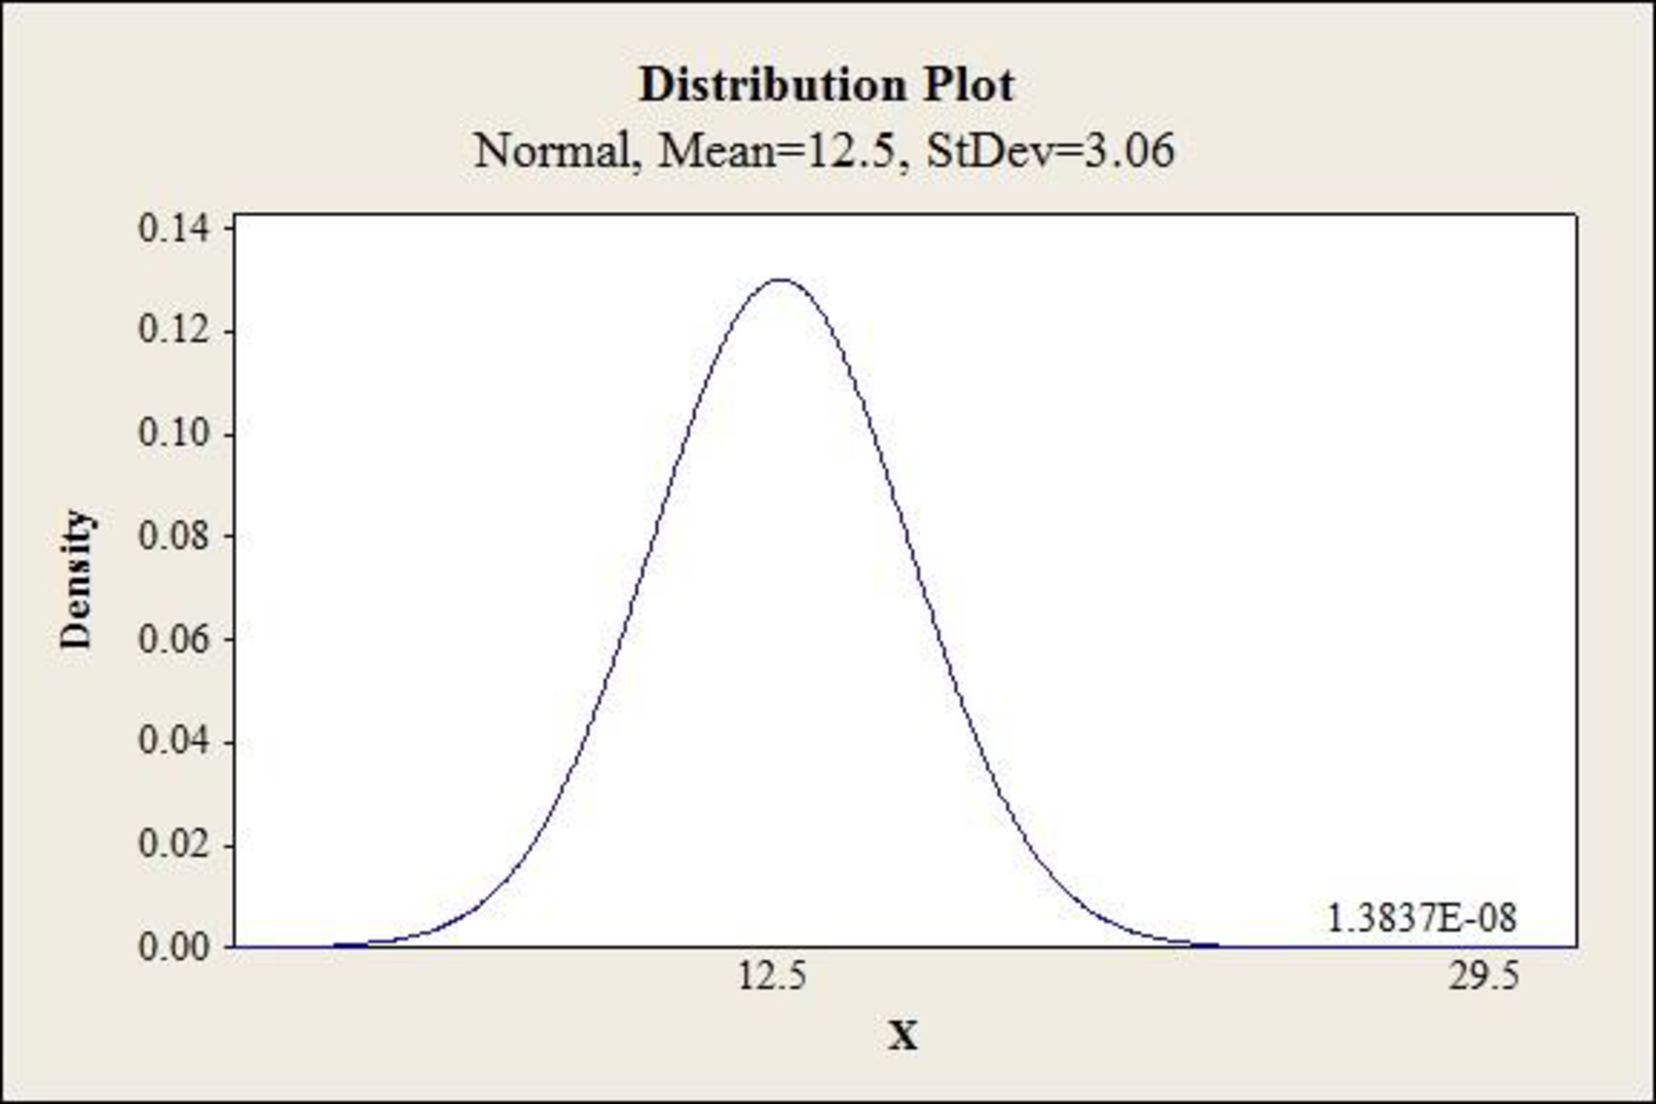
From the graph, the probability value is 0.000. Thus, the percentage of the students is 0.
Want to see more full solutions like this?
Chapter 6 Solutions
Essentials of Statistics for Business and Economics (with XLSTAT Printed Access Card)


 Holt Mcdougal Larson Pre-algebra: Student Edition...AlgebraISBN:9780547587776Author:HOLT MCDOUGALPublisher:HOLT MCDOUGAL
 College Algebra (MindTap Course List)AlgebraISBN:9781305652231Author:R. David Gustafson, Jeff HughesPublisher:Cengage Learning