
Videos
Throughout the picturesque valleys of mid-18th-century Germany echoed the song of the Neuländer (newlander), enticing journeymen who struggled to feed their families with the dream and promise of colonial America. The typical Neuländer sought to sign up several families from a village for immigration to a particular colony. By registering a group of neighbors, rather than isolated families, the agent increased the likelihood that his signees would not stray to the proposals of a competitor. Additionally, by signing large groups, the Neuländer fattened his purse, to the tune of one to two florins a head.
Generally, the Germans who chose to undertake the hardship of a trans-Atlantic voyage were poor, yet the cost of such a voyage was high. Records from a 1753 voyage indicate that the cost of an adult fare (one freight) from Rotterdam to Boston was 7.5 pistoles. Children aged 4 to 13 were assessed at half the adult rate (one-half freight) and those under 4 were not charged. To get a sense of the expense involved, an adult fare is equivalent to approximately $2000! Many immigrants did not have the necessary funds to purchase passage and, determined to make the crossing, paid with years of indentured servitude.
As a historian studying the influence of these German immigrants on colonial America, Hans Langenscheidt is interested in describing various demographic characteristics of these people. Unfortunately, accurate records are rare. He has discovered a partially reconstructed 1752 passenger list for a ship, the St. Andrew, containing the names of the heads of families, a list of family members traveling, their parish of origin, and the number of freights each family purchased. Unfortunately, some data are missing for some families. Langenscheidt believes that the demographic parameters of this passenger list are likely to be similar to those of the other voyages taken from Germany to America during the mid-18th century. Assuming that he is correct, he believes that it is appropriate to create a discrete probability distribution for a number of demographic variables for this population of German immigrants, presented below.
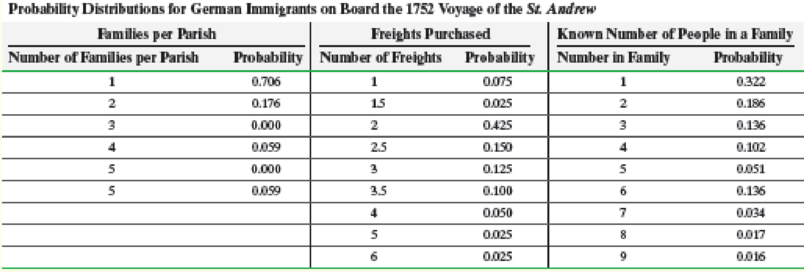
5. Langenscheidt came across a fragment of another ship’s passenger list containing information for six families. Of these six, five families purchased more than four freights. Using the information in the appropriate probability distribution for the St. Andrew, calculate the probability that at least five of six German immigrant families purchased more than four freights. Does it seem likely that these families came from a population similar to that of the Germans on board the St. Andrew? Explain.
Want to see the full answer?
Check out a sample textbook solution
Chapter 6 Solutions
EP FUNDAMENTALS OF STAT.-MYLAB STAT.ACC


- The college graduates of 2000 could hardly have asked for better luck. The unemployment rate dropped to 4.1 % in May 2000- roughly, the lowest level in a generation- and employers were literally scrambling for new hires. Starting salaries rose, many graduating seniors had numerous job offers, and some firms even offered $10,000- $20,000 bonuses to students who signed the dotted line. Three years later, the job market for the Class of 2003 was rather different. U.S. economic growth had slowed to a crawl, and then to a halt. Companies that had stocked up on recent college grads in the tighter labour markets of 1998-2000 found themselves with more than they knew what to do with in 2002 and 2003. They were not eager to hire more. Bonuses and other “perks” disappeared; job offers became scarcer. With the unemployment rate around 6% in May and June of 2003, the job market was far from the worst ever. But it was nothing like the glory days of 2000. YOU ARE REQUIRED TO: (iv) Briefly…arrow_forwardThe Conch Café, located in Gulf Shores, Alabama, features casual lunches with a great view of the Gulf of Mexico. To accommodate the increase in business during the summer vacation season, Fuzzy Conch, the owner, hires a large number of servers as seasonal help. When he interviews a prospective server, he would like to provide data on the amount a server can earn in tips. He believes that the amount of the bill and the number of diners are both related to the amount of the tip. He gathered the following sample information. Customer Amount of Tip Amount of Bill Number of Diners Customer Amount of Tip Amount of Bill Number of Diners 1 $ 7.00 $ 48.97 5 16 $ 3.30 $ 23.59 2 2 4.50 28.23 4 17 3.50 22.30 2 3 1.00 10.65 1 18 3.25 32.00 2 4 2.40 19.82 3 19 5.40 50.02 4 5 5.00 28.62 3 20 2.25 17.60 3 6 4.25 24.83 2 21 5.50 44.47 4 7 0.50 6.24 1 22 3.00 20.27 2…arrow_forwardThe Conch Café, located in Gulf Shores, Alabama, features casual lunches with a great view of the Gulf of Mexico. To accommodate the increase in business during the summer vacation season, Fuzzy Conch, the owner, hires a large number of servers as seasonal help. When he interviews a prospective server, he would like to provide data on the amount a server can earn in tips. He believes that the amount of the bill and the number of diners are both related to the amount of the tip. He gathered the following sample information. Customer Amount of Tip Amount of Bill Number of Diners Customer Amount of Tip Amount of Bill Number of Diners 1 $ 6.05 $ 73.22 1 16 $ 3.30 $ 23.59 2 2 4.50 28.23 4 17 3.50 22.30 2 3 1.00 10.65 1 18 3.25 32.00 2 4 2.40 19.82 3 19 5.40 50.02 4 5 5.00 28.62 3 20 2.25 17.60 3 6 4.25 24.83 2 21 1.40 41.80 5 7 .50 6.25 1 22 3.00 20.27 2…arrow_forward
- In a section of an English 201 class, the professor decides to be “generous” with the students and will grade the next exam in a unique way. Grades will be assigned according to the following rule: The top 10% receive A’s, the next 20% receive B’s, the middle 40% receive C’s, the next 20% receive D’s, and the bottom 10% receive F’s. Some may refer to this type of grading as “curving” which gave rise to the phrase, “Professor, do you curve the grades?” (a) Where did the term "curving" come from (b) Which curve is this referring to? (c) What do you think is the purpose of grading exams on a “curve”. Students usually like when professors grade on a curve even though it is likely they do not understand what that involves. (a) Who do you think benefits from grading exams in a curve? Do you think all students will like this method? Explain. Do you think this method of grading is fair to all students? Under what circumstances would some students NOT like this method of grading? Explain.arrow_forwardThe question is in the imagearrow_forwardFrom 1840 to 1850, more than 12,000 pioneers migrated west in wagon trains. It was typically about a 2,000-mile journey, and pioneers averaged about 10 miles per day. One pioneer family, the Smiths, is planning to join a wagon train traveling west to Oregon. The destination is Fort Vancouver, which is near present-day Portland. The family plans to join a wagon train in St. Louis. However, the trains follow various trails west that are mostly determined by the location of forts and trading posts along the way. The Smith family wants to choose a wagon train that will get them to Oregon in the shortest amount of time. They have checked around with the different wagon train leaders plus immigrants, soldiers, fur traders, and scouts who have previously made the trip west, and from the information they have gathered, they have developed the following network, with estimated times (in days) along each branch: a. Determine the shortest route for the Smiths from St. Louis to Ft. Vancouver. b.…arrow_forward
- Emma's .. che-Go, a large convenience store that makes a good deal of money from magazine sales, has three possible locations in the store for its magazine rack: in the front of the store (to attract "impulse buying" by all customers), on the left-hand side of the store (to attract teenagers who are on that side of the store looking at the candy and soda), and in the back of the store (to attract the adults searching through the alcohol cases). The manager at Emma's experiments over the course of several months by rotating the magazine rack among the three locations, choosing a sample of 42 days at each location. Each day, the manager records the amount of money brought in from the sale of magazines. Below are the sample mean daily sales (in dollars) for each of the locations, as well as the sample variances: Sample Sample Sample size Group mean variance Front 42 219.2 331.5 Left-hand side 42 213.0 552.5 Right-hand side 42 210.4 337.4 Send data to calculator Send data to Excel Assume…arrow_forwardEmma's .. che-Go, a large convenience store that makes a good deal of money from magazine sales, has three possible locations in the store for its magazine rack: in the front of the store (to attract "impulse buying" by all customers), on the left-hand side of the store (to attract teenagers who are on that side of the store looking at the candy and soda), and in the back of the store (to attract the adults searching through the alcohol cases). The manager at Emma's experiments over the course of several months by rotating the magazine rack among the three locations, choosing a sample of 47 days at each location. Each day, the manager records the amount of money brought in from the sale of magazines. Below are the sample mean daily sales (in dollars) for each of the locations, as well as the sample variances: Sample Sample Sample size Group mean variance Front 47 218.7 648.0 Left-hand side 47 221.5 558.8 Right-hand side 47 213.8 314.3 Send data to calculator Send data to Excel Suppose…arrow_forwardSouthwestern University (SWU), a large state college in Stephenville, Texas, enrolls close to 20,000 students. The school is a dominant force in the small city, with more students during fall and spring than permanent residents. Always a football powerhouse, SWU is usually in the top 20 in college football rankings. Since the legendary Phil Flamm was hired as its head coach in 2009 (in hopes of reaching the elusive number 1 ranking), attendance at the five Saturday home games each year increased. Prior to Flamm's arrival, attendance generally averaged 25,000 to 29,000 per game. Season ticket sales bumped up by 10,000 just with the announcement of the new coach's arrival Stephenville and SWU were ready to move to the big time! The immediate issue facing SWU, however, was not NCAA ranking. It was capacity. The existing SWU stadium, built in 1953, has seating for 54,000 fans. The following table indicates attendance at each game for the past 6 years. Southwestern University Football Game…arrow_forward
- In a section of an English 201 class, the professor decides to be "generous" with the students and will grade the exam in a unique way. Grades will be assigned according to the follwing rule: the top receives A's, the next 20% receive B's, the middle 40% receive C's, the next 20% receive D's, and the bottom 10% receive F's. Some may refer to this as "curving" The 40 grades were as follows: 30, 53, 88, 69, 77, 57, 58, 43, 63, 51, 69, 88, 86, 84, 50, 83, 91, 76, 57, 90, 45, 79, 41, 80, 62, 66, 71, 58, 92, 85, 57, 74, 63, 60, 99, 85, 70, 93, 67, 53 Do you think ths method of grading is fair to all students? Explain your answer 2. Under what circumstances would some students NOT like this method of grading? 3. Find the lowest score on the final exam that would qualify a student for an A, a B, a C, and a D 4. After doing the previous 3 parts explain the term "grading on a curve" what does it involve? what curve is it referring to?arrow_forwardIn a famous study done in the 1960s two dolphins, Doris and Buzz, were trained to work together to earn fish. Doris was shown a light underwater. If the light was on steadily, her partner Buzz on the other side of the tank needed to press a button on the right for them to earn fish. If the light was blinking, he needed to press a button on the left. At one point in the study, the researcher hung a canvas in the middle of the tank in such a way that Buzz could not see the light. After looking at the light, Doris "swam near the curtain and began to whistle loudly. Shortly after that Buzz whistled back and then pressed the correct button". (Tintle, Rossman and Chance, MAA Prep Workshop) Of course, getting it right once was not enough to convince the scientists that there was really communication going on. It turned out, that in 15 out of 16 trials the dolphin pushed the correct button. Of course, it is possible that this happened just out of random chance - that the second dolphin just…arrow_forwardIn a famous study done in the 1960s two dolphins, Doris and Buzz, were trained to work together to earn fish. Doris was shown a light underwater. If the light was on steadily, her partner Buzz on the other side of the tank needed to press a button on the right for them to earn fish. If the light was blinking, he needed to press a button on the left. At one point in the study, the researcher hung a canvas in the middle of the tank in such a way that Buzz could not see the light. After looking at the light, Doris “swam near the curtain and began to whistle loudly. Shortly after that Buzz whistled back and then pressed the [correct] button”. (Tintle, Rossman and Chance, MAA Prep Workshop) Of course, getting it right once was not enough to convince the scientists that there was really communication going on. It turned out, that in 15 out of 16 trials the dolphin pushed the correct button. Of course, it is possible that this happened just out of random chance - that the second dolphin just…arrow_forward
 MATLAB: An Introduction with ApplicationsStatisticsISBN:9781119256830Author:Amos GilatPublisher:John Wiley & Sons Inc
 Probability and Statistics for Engineering and th...StatisticsISBN:9781305251809Author:Jay L. DevorePublisher:Cengage Learning
 Statistics for The Behavioral Sciences (MindTap C...StatisticsISBN:9781305504912Author:Frederick J Gravetter, Larry B. WallnauPublisher:Cengage Learning
 Elementary Statistics: Picturing the World (7th E...StatisticsISBN:9780134683416Author:Ron Larson, Betsy FarberPublisher:PEARSON
 The Basic Practice of StatisticsStatisticsISBN:9781319042578Author:David S. Moore, William I. Notz, Michael A. FlignerPublisher:W. H. Freeman
 Introduction to the Practice of StatisticsStatisticsISBN:9781319013387Author:David S. Moore, George P. McCabe, Bruce A. CraigPublisher:W. H. Freeman