
Concept explainers
Videos
Uniform Distribution: Measurement Errors Measurement errors from instruments are often modeled using the uniform distribution (see Problem 16). To determine the
- (a) less than +0.03 microsecond (i.e., −0.05 ≤ x < 0.03)?
- (b) more than −0.02 microsecond?
- (c) between −0.04 and +0.01 microsecond?
- (d) Find the mean and standard deviation of measurement errors. Measurements from an instrument are called unbiased if the mean of the measurement errors is zero. Would you say the measurements for these acoustical sensors are unbiased? Explain.
16. Expand Your Knowledge: Continuous Uniform Probability Distribution Let α and β be any two constants such that α < β. Suppose we choose a point x at random in the interval from α to β. In this context the phrase at random is taken to mean that the point x is as likely to be chosen from one particular part of the interval as any other part. Consider the rectangle.
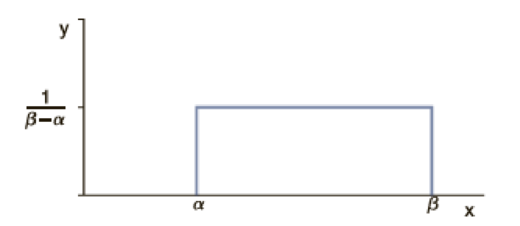
The base of the rectangle has length β − α and the height of the rectangle is 1/(β − α), so the area of the rectangle is 1. As such, this rectangle’s top can be thought of as part of a probability density curve. Since we specify that x must lie between α and β, the probability of a point occurring outside the interval [α, β] is, by definition, 0. From a geometric point of view, x chosen at random from α to β means we are equally likely to land anywhere in the interval from α to β. For this reason, the top of the (rectangle’s) density curve is flat or uniform.
Now suppose that a and b are numbers such that α ≤ a < b ≤ β. What is the probability that a number x chosen at random from α to β will fall in the interval [a, b]? Consider the graph
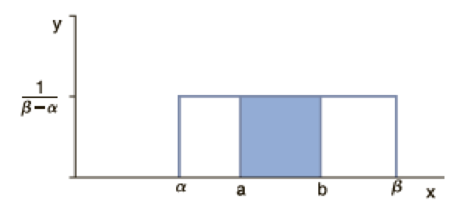
Because x is chosen at random from [α, β], the area of the rectangle that lies above [a, b] is the probability that x lies in [a, b]. This area is
In this way we can assign a probability to any interval inside [α, β]. This probability distribution is called the continuous uniform distribution (also called the rectangular distribution). Using some extra mathematics, it can be shown that if x is a random variable with this distribution, then the mean and standard deviation of x are
Sedimentation experiments are very important in the study of biology, medicine, hydrodynamics, petroleum engineering, civil engineering, and so on. The size (diameter) of approximately spherical particles is important since larger particles hinder and sometimes block the movement of smaller particles. Usually the size of sediment particles follows a uniform distribution (Reference: Y. Zimmels, “Theory of Kindred Sedimentation of Polydisperse Mixtures,” AIChE Journal, Vol. 29, No. 4, pp. 669–676).
Suppose a veterinary science experiment injects very small, spherical pellets of low-level radiation directly into an animal’s bloodstream. The purpose is to attempt to cure a form of recurring cancer. The pellets eventually dissolve and pass through the animal’s system. Diameters of the pellets are uniformly distributed from 0.015 mm to 0.065 mm. If a pellet enters an artery, what is the probability that it will be the following sizes?
- (a) 0.050 mm or larger. Hint: All particles are between 0.015 mm and 0.065 mm, so larger than 0.050 means 0.050 ≤ x ≤ 0.065.
- (b) 0.040 mm or smaller
- (c) between 0.035 mm and 0.055 mm
- (d) Compute the mean size of the particles.
- (e) Compute the standard deviation of particle size.
Want to see the full answer?
Check out a sample textbook solution
Chapter 6 Solutions
Understandable Statistics: Concepts and Methods


 MATLAB: An Introduction with ApplicationsStatisticsISBN:9781119256830Author:Amos GilatPublisher:John Wiley & Sons Inc
 Probability and Statistics for Engineering and th...StatisticsISBN:9781305251809Author:Jay L. DevorePublisher:Cengage Learning
 Statistics for The Behavioral Sciences (MindTap C...StatisticsISBN:9781305504912Author:Frederick J Gravetter, Larry B. WallnauPublisher:Cengage Learning
 Elementary Statistics: Picturing the World (7th E...StatisticsISBN:9780134683416Author:Ron Larson, Betsy FarberPublisher:PEARSON
 The Basic Practice of StatisticsStatisticsISBN:9781319042578Author:David S. Moore, William I. Notz, Michael A. FlignerPublisher:W. H. Freeman
 Introduction to the Practice of StatisticsStatisticsISBN:9781319013387Author:David S. Moore, George P. McCabe, Bruce A. CraigPublisher:W. H. Freeman