
Concept explainers
Videos
(a)
Differences, if any, while comparing the probability distributions of X and Y using histogram.
(a)
Answer to Problem 20E
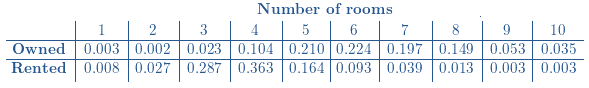
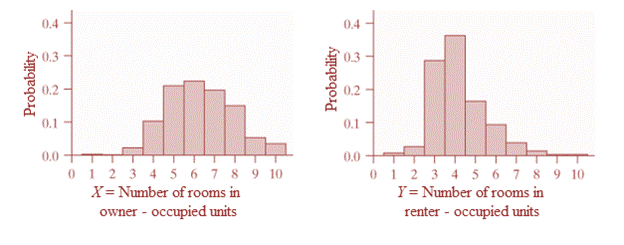
Both distributions are skewed to right with most typical number of rooms in owner − occupied units is 6 rooms and most typical number of rooms in renter − occupied units is 4 rooms.
The owner − occupied units have greater spread and neither distribution shows outliers.
Explanation of Solution
Given information:
X : the number of rooms in randomly selected owner − occupied unit
Y : the number of rooms in randomly selected renter − occupied unit
Distributions of the number of rooms for owner − occupied units and renter − occupied units in San Jose, California:

Histograms for X and Y :

Shape: In the histograms, the highest bars are slightly to the left, whereas a tail of smaller bars is to the right. Thus, both distributions are slightly skewed to the right.
Center: In first histogram, the highest bar for owner − occupied units is at 6. Thus, the most typical number of rooms in owner − occupied units is 6 rooms.In second histogram, the highest bar for renter − occupied units is at 4. Thus, the most typical number of rooms in renter − occupied units is 4 rooms.
Spread: Since the width of histogram for owner − occupied units is wider than the width of the histogram for renter − occupied units. Thus, the spread of the number of rooms in owner − occupied units is greater than the spread of the number of rooms in renter − occupied units.
Unusual features: Since there are no gaps in the histogram, neither distribution shows outliers.
(b)
Expected numberof rooms for both types of housing unit and relevance for this difference.
(b)
Answer to Problem 20E
Expected number of rooms,
For X :
For Y :
Explanation of Solution
Given information:
X : the number of rooms in randomly selected owner − occupied unit
Y : the number of rooms in randomly selected renter − occupied unit
Distributions of the number of rooms for owner − occupied units and renter − occupied units in San Jose, California:

Histograms for X and Y :

The expected mean is the sum of the product of each possibility x with its probability
For owner - occupied:
For rented − occupied:
Now,
Note that
The expected number of rooms for owner − occupied units is greater than the expected number of rooms in renter − occupied units.
Thus,
It makes sense as the peak in the histogram for owner − occupied units is slightly to the right of the peak in the histogram for renter − occupied units.
(c)
Relevance for the difference in standard deviation of two random variables.
(c)
Answer to Problem 20E
The standard deviation confirms the histogram of the owner − occupied units is wider than the histogram of the renter − occupied units.
Explanation of Solution
Given information:
X : the number of rooms in randomly selected owner − occupied unit
Y : the number of rooms in randomly selected renter − occupied unit
Distributions of the number of rooms for owner − occupied units and renter − occupied units in San Jose, California:
Histograms for X and Y :
Standard deviation of two random variables,
For X :
For Y :
From Part (a),
We conclude that
The spread of the owner - occupied distribution was greater than the spread of the renter - occupied distribution due to wider histogram of the owner − occupied units.
According to the statement,
The standard deviation of “owned” is greater than the standard deviation of “rented”.
Thus,
The standard deviation confirms the conclusion.
Chapter 6 Solutions
PRACTICE OF STATISTICS F/AP EXAM
Additional Math Textbook Solutions
Introductory Statistics
Elementary Statistics Using Excel (6th Edition)
Statistics: The Art and Science of Learning from Data (4th Edition)
Introductory Statistics (10th Edition)
Introductory Statistics
Elementary Statistics: Picturing the World (7th Edition)


 MATLAB: An Introduction with ApplicationsStatisticsISBN:9781119256830Author:Amos GilatPublisher:John Wiley & Sons Inc
 Probability and Statistics for Engineering and th...StatisticsISBN:9781305251809Author:Jay L. DevorePublisher:Cengage Learning
 Statistics for The Behavioral Sciences (MindTap C...StatisticsISBN:9781305504912Author:Frederick J Gravetter, Larry B. WallnauPublisher:Cengage Learning
 Elementary Statistics: Picturing the World (7th E...StatisticsISBN:9780134683416Author:Ron Larson, Betsy FarberPublisher:PEARSON
 The Basic Practice of StatisticsStatisticsISBN:9781319042578Author:David S. Moore, William I. Notz, Michael A. FlignerPublisher:W. H. Freeman
 Introduction to the Practice of StatisticsStatisticsISBN:9781319013387Author:David S. Moore, George P. McCabe, Bruce A. CraigPublisher:W. H. Freeman