Concept explainers
Videos
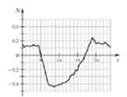
Carbon uptake An important process in the study of global warming and greenhouse gases is the net ecosystem exchange, which is the rate at which carbon leaves an ecosystem and enters the atmosphere in a particular geographic region. Let N(t) equal the net ecosystem exchange on an average July day in a high-altitude coniferous forest, where N(t) is measured in grams of carbon per square meter per hour and f is the number of hours past midnight so that 0 ≤ t ≤ 24 (see figure). Negative values of N correspond to times when the amount of carbon in the atmosphere decreases, and positive values of N occur when the amount of carbon in the atmosphere increases.
a. Trees and other plants help reduce carbon emissions in the atmosphere by using photosynthesis to absorb carbon dioxide and release oxygen Give a possible explanation why N is negative on the interval 5 < t < 17.
b. The cumulative net carbon uptake,
Want to see the full answer?
Check out a sample textbook solution
Chapter 6 Solutions
Calculus: Early Transcendentals (3rd Edition)
Additional Math Textbook Solutions
Precalculus
Calculus: Early Transcendentals (2nd Edition)
Calculus and Its Applications (11th Edition)
University Calculus: Early Transcendentals (3rd Edition)
Precalculus (10th Edition)
Precalculus: Concepts Through Functions, A Unit Circle Approach to Trigonometry (4th Edition)


- Decay of Litter Litter such as leaves falls to the forest floor, where the action of insects and bacteria initiates the decay process. Let A be the amount of litter present, in grams per square meter, as a function of time t in years. If the litter falls at a constant rate of L grams per square meter per year, and if it decays at a constant proportional rate of k per year, then the limiting value of A is R=L/k. For this exercise and the next, we suppose that at time t=0, the forest floor is clear of litter. a. If D is the difference between the limiting value and A, so that D=RA, then D is an exponential function of time. Find the initial value of D in terms of R. b. The yearly decay factor for D is ek. Find a formula for D in term of R and k. Reminder:(ab)c=abc. c. Explain why A=RRekt.arrow_forwardSales Growth In this exercise, we develop a model for the growth rate G, in thousands of dollars per year, in sales of the product as a function of the sales level s, in thousands of dollars. The model assumes that there is a limit to the total amount of sales that can be attained. In this situation, we use the term unattained sales for difference this limit and the current sales level. For example, if we expect sales grow to 3 thousand dollars in the long run, then 3-s is the unattained sales. The model states that the growth rate G is proportional to the product of the sales level s, and the unattained sales. Assume that the constant of proportionality is 0.3 and that the sales grow to 2 thousand dollars in the long run. a.Find the formula for unattained sales. b.Write an equation that shows the proportionality relation for G. c.On the basis of the equation from the part b, make a graph of G as a function of s. d.At what sales level is the growth rate as large as possible? e.What is the largest possible growth rate?arrow_forwardGrazing Kangaroos The amount of vegetation eaten in a day by a grazing animal V of food available measured as biomass, in units such as pounds per acre. This relationship is called the functional response. If there is little vegetation available, the daily intake will be small, since the animal will have difficulty finding and eating the food. As the amount of food biomass increases, so does the daily intake. Clearly, though, there is a limit to the amount the animal will eat, regardless of the amount of food available. This maximum amount eaten is the satiation level. a.For the western grey kangaroo of Australia, the functional response is G=2.54.8e0.004V, where G=G(V) is the daily intake measured in pounds and V is the vegetation biomass measured in pounds per acre. i. Draw a graph of G against V. Include vegetation biomass levels up to 2000 pounds per acre. ii. Is the graph you found in part i concave up or concave down? Explain in practical terms what your answer means about how this kangaroo feeds. iii. There is a minimal vegetation biomass level below which the western grey kangaroo will eat nothing. Another way of expressing this is to say that the animal cannot reduce the food biomass below this level. Find this minimal level. iv. Find the satiation level for the western grey kangaroo. b. For the red kangaroo of Australia, the functional response is R=1.91.9e0.033V, Where R is the daily intake measured in pounds and V is the vegetation biomass measured in pounds per acre. i. Add the graph of R against V to the graph of G you drew in part a. ii. A simple measure of the grazing efficiency of an animal involves the minimal vegetation biomass level described above: The lower the minimal level for an animal, the more efficient it is at grazing. Which is more efficient at grazing, the western grey kangaroo or the red kangaroo?arrow_forward
 Functions and Change: A Modeling Approach to Coll...AlgebraISBN:9781337111348Author:Bruce Crauder, Benny Evans, Alan NoellPublisher:Cengage Learning
 Algebra & Trigonometry with Analytic GeometryAlgebraISBN:9781133382119Author:SwokowskiPublisher:Cengage