Concept explainers
Videos
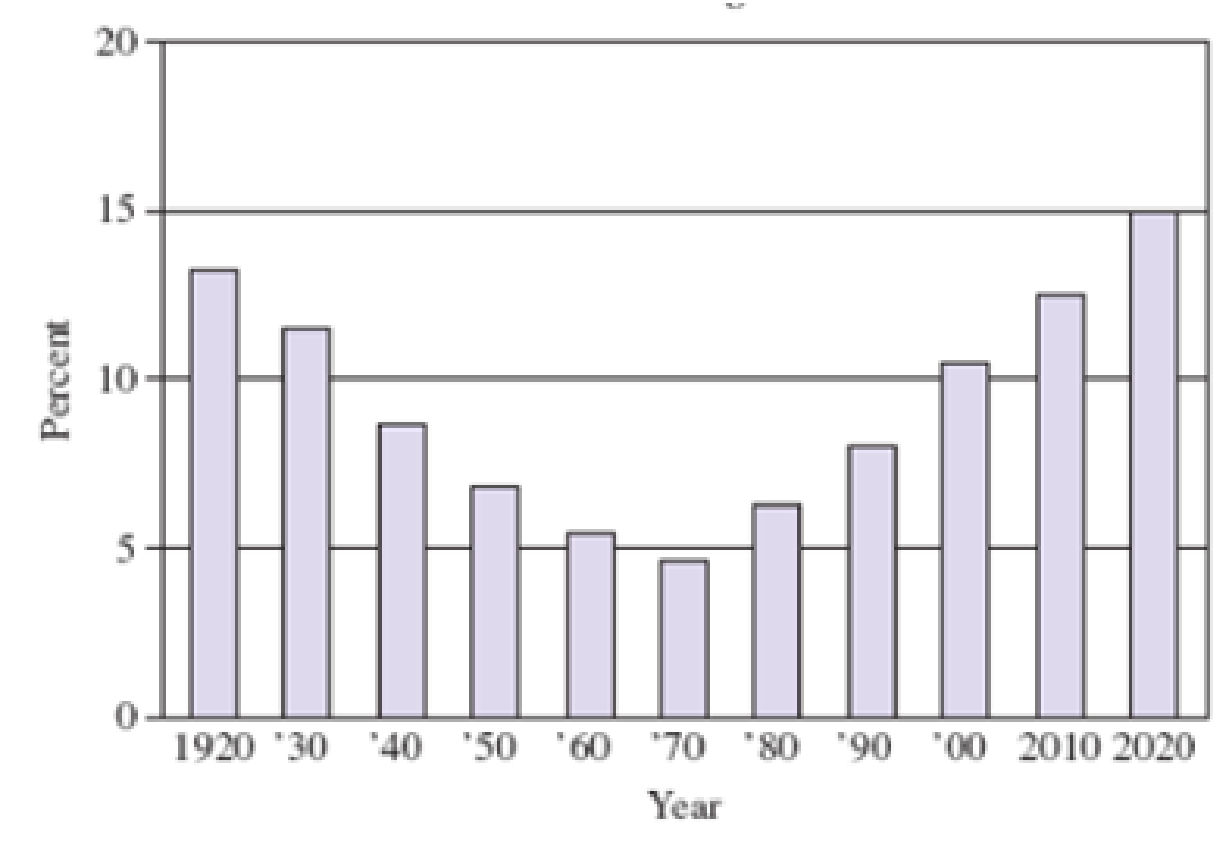
U.S. Foreign-Born Population The graph on the top on page 384 indicates the percentage of the U S population that was foreign-born for each decade from 1920 to 2010, and the projected percentage for 2020. The function f (x) = 0.004x2 − 0.34x + 13.79 can be used to estimate the percentage of the US population that was foreign-born, where x is the number of years since 1920 and 0 ≤ x ≤ 100.
- a. Use the function f(x) to estimate the percentage of the US population that was foreign-born in 2014. Round your answer to the nearest percent.
- b. Of the years illustrated on the graph, determine the year in which the percentage of the U.S. population that was foreign-born was a minimum.
- c. Determine the x-coordinate of the vertex of the graph of the function f(x).
Then use this value in the function f(x) to estimate the minimum percentage of the U.S. population that was foreign-born.
Round your answer for the vertex to the nearest whole number.
Round your answer for the population to the nearest percent.
Want to see the full answer?
Check out a sample textbook solution
Chapter 6 Solutions
Survey of Mathematics with Applications with Integrated Review, A, Books a la carte edition, plus MyLab Math Student Access Card and Sticker (10th Edition)


 Glencoe Algebra 1, Student Edition, 9780079039897...AlgebraISBN:9780079039897Author:CarterPublisher:McGraw Hill
 Trigonometry (MindTap Course List)TrigonometryISBN:9781337278461Author:Ron LarsonPublisher:Cengage Learning
 College Algebra (MindTap Course List)AlgebraISBN:9781305652231Author:R. David Gustafson, Jeff HughesPublisher:Cengage Learning
 Algebra & Trigonometry with Analytic GeometryAlgebraISBN:9781133382119Author:SwokowskiPublisher:Cengage
 Big Ideas Math A Bridge To Success Algebra 1: Stu...AlgebraISBN:9781680331141Author:HOUGHTON MIFFLIN HARCOURTPublisher:Houghton Mifflin Harcourt