
ESSENTIALS OF STATS LBCC >CI<
2nd Edition
ISBN: 9781323121771
Author: Triola
Publisher: PEARSON C
expand_more
expand_more
format_list_bulleted
Concept explainers
Videos
Textbook Question
Chapter 6.2, Problem 17BSC
Seat Designs. In Exercises 13–20, use the data in the table below for sitting adult males and females (based on anthropometric survey data from Gordon, Churchill, et al.). These data are used often in the design of different seats, including aircraft seats, train seats, theater seats, and classroom seats. (Hint: Draw a graph in each case.)
Sitting Back-to-Knee Length (inches)
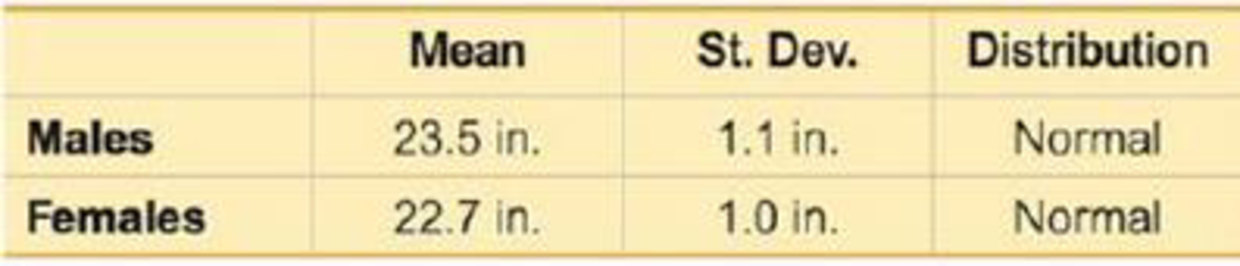
17. For males, find P90, which is the length separating the bottom 90% from the top 10%.
Expert Solution & Answer

Learn your wayIncludes step-by-step video

schedule03:49
Students have asked these similar questions
The segmented bar graphs below depict data from the
NAAL (National Assessment of Adult Literacy) conduct-ed in 2003.
(Source: Kutner, M., et al, Literacy in Everyday Life:
Results From the 2003 National Assessment of Adult Lit-eracy (NCES 2007–480).U.S. Department of Education.
Washington, DC)
Does there appear to be a relationship between volunteer-ism and literacy level?
a) Yes, all three bars have the same number of segments.b) Yes, because all three bars have the same height.c) Yes, because the corresponding segments of the threebars have different heights.d) No, because the corresponding segments of the threebars have different heights.e) No, because the sums of the 3 proportions in each barare identical.
Using the displays in part ‘a’ sheet 2, compare and contrast the two data sets.
How strongly do physical characteristics of sisters and brothers correlate? The data in the table give the heights (in inches) of 1212 adult pairs.
Brother
7171
6868
6666
6767
7070
7171
7070
7373
7272
6565
6666
7070
Sister
6969
6464
6565
6363
6565
6262
6565
6464
6666
5959
6262
6464
To access the data, click the link for your preferred software format.
CSV Excel (xls) Excel (xlsx) JMP Mac-Text Minitab14-18 Minitab18+ PC-Text R SPSS TI CrunchIt!
© Macmillan Learning
Use your calculator or software to find the correlation, ?,�, and equation of the least‑squares regression line for predicting sister's height from brother's height, ?̂ .�^. Make a scatterplot of the data and add the regression line to your plot. Give your answer to three decimal places.
Enter the equation of the least‑squares regression line, with the numerical values rounded to three decimal places and ?� as the explanatory variable. (If you are using CrunchIt, adjust the…
Chapter 6 Solutions
ESSENTIALS OF STATS LBCC >CI<
Ch. 6.1 - Normal Distribution Whats wrong with the following...Ch. 6.1 - Normal Distribution A normal distribution is...Ch. 6.1 - Standard Normal Distribution Identify the two...Ch. 6.1 - Notation What does the notation z indicate?Ch. 6.1 - Continuous Uniform Distribution. In Exercises 58,...Ch. 6.1 - Continuous Uniform Distribution. In Exercises 58,...Ch. 6.1 - Continuous Uniform Distribution. In Exercises 58,...Ch. 6.1 - Continuous Uniform Distribution. In Exercises 58,...Ch. 6.1 - Standard Normal Distribution. In Exercises 912,...Ch. 6.1 - Standard Normal Distribution. In Exercises 912,...
Ch. 6.1 - Standard Normal Distribution. In Exercises 912,...Ch. 6.1 - Standard Normal Distribution. In Exercises 912,...Ch. 6.1 - Standard Normal Distribution. In Exercises 1316,...Ch. 6.1 - Standard Normal Distribution. In Exercises 1316,...Ch. 6.1 - Standard Normal Distribution. In Exercises 1316,...Ch. 6.1 - Standard Normal Distribution. In Exercises 1316,...Ch. 6.1 - Standard Normal Distribution. In Exercises 1736,...Ch. 6.1 - Standard Normal Distribution. In Exercises 1736,...Ch. 6.1 - Standard Normal Distribution. In Exercises 1736,...Ch. 6.1 - Standard Normal Distribution. In Exercises 1736,...Ch. 6.1 - Standard Normal Distribution. In Exercises 1736,...Ch. 6.1 - Standard Normal Distribution. In Exercises 1736,...Ch. 6.1 - Standard Normal Distribution. In Exercises 1736,...Ch. 6.1 - Standard Normal Distribution. In Exercises 1736,...Ch. 6.1 - Standard Normal Distribution. In Exercises 1736,...Ch. 6.1 - Standard Normal Distribution. In Exercises 1736,...Ch. 6.1 - Standard Normal Distribution. In Exercises 1736,...Ch. 6.1 - Standard Normal Distribution. In Exercises 1736,...Ch. 6.1 - Standard Normal Distribution. In Exercises 1736,...Ch. 6.1 - Standard Normal Distribution. In Exercises 1736,...Ch. 6.1 - Standard Normal Distribution. In Exercises 1736,...Ch. 6.1 - Standard Normal Distribution. In Exercises 1736,...Ch. 6.1 - Standard Normal Distribution. In Exercises 1736,...Ch. 6.1 - Standard Normal Distribution. In Exercises 1736,...Ch. 6.1 - Standard Normal Distribution. In Exercises 1736,...Ch. 6.1 - Standard Normal Distribution. In Exercises 1736,...Ch. 6.1 - Finding Bone Density Scores. In Exercises 3740...Ch. 6.1 - Finding Bone Density Scores. In Exercises 3740...Ch. 6.1 - Finding Bone Density Scores. In Exercises 3740...Ch. 6.1 - Finding Bone Density Scores. In Exercises 3740...Ch. 6.1 - Critical Values. In Exercises 4144, find the...Ch. 6.1 - Critical Values. In Exercises 4144, find the...Ch. 6.1 - Critical Values. In Exercises 4144, find the...Ch. 6.1 - Critical Values. In Exercises 4144, find the...Ch. 6.1 - Basis for the Range Rule of Thumb and the...Ch. 6.1 - Basis for the Range Rule of Thumb and the...Ch. 6.1 - Basis for the Range Rule of Thumb and the...Ch. 6.1 - Basis for the Range Rule of Thumb and the...Ch. 6.1 - Significance For bone density scores that are...Ch. 6.1 - Distributions In a continuous uniform...Ch. 6.2 - Birth Weights Based on Data Set 4 Births in...Ch. 6.2 - Birth Weights Based on Data Set 4 Births in...Ch. 6.2 - Normal Distributions What is the difference...Ch. 6.2 - Random Digits Computers are commonly used to...Ch. 6.2 - IQ Scores. In Exercises 58, find the area of the...Ch. 6.2 - IQ Scores. In Exercises 58, find the area of the...Ch. 6.2 - IQ Scores. In Exercises 58, find the area of the...Ch. 6.2 - IQ Scores. In Exercises 58, find the area of the...Ch. 6.2 - IQ Scores. In Exercises 912, find the indicated IQ...Ch. 6.2 - IQ Scores. In Exercises 912, find the indicated IQ...Ch. 6.2 - IQ Scores. In Exercises 912, find the indicated IQ...Ch. 6.2 - IQ Scores. In Exercises 912, find the indicated IQ...Ch. 6.2 - Seat Designs. In Exercises 1320, use the data in...Ch. 6.2 - Seat Designs. In Exercises 1320, use the data in...Ch. 6.2 - Seat Designs. In Exercises 1320, use the data in...Ch. 6.2 - Seat Designs. In Exercises 1320, use the data in...Ch. 6.2 - Seat Designs. In Exercises 1320, use the data in...Ch. 6.2 - Seat Designs. In Exercises 1320, use the data in...Ch. 6.2 - Seat Designs. In Exercises 1320, use the data in...Ch. 6.2 - Seat Designs. In Exercises 1320, use the data in...Ch. 6.2 - In Exercises 2124, use these parameters (based on...Ch. 6.2 - In Exercises 2124, use these parameters (based on...Ch. 6.2 - In Exercises 2124, use these parameters (based on...Ch. 6.2 - In Exercises 2124, use these parameters (based on...Ch. 6.2 - Eye Contact In a study of facial behavior, people...Ch. 6.2 - Designing a Work Station A common design...Ch. 6.2 - Jet Ejection Seats The U.S. Air Force once used...Ch. 6.2 - Quarters After 1964, quarters were manufactured so...Ch. 6.2 - Low Birth Weight The University of Maryland...Ch. 6.2 - Body Temperatures Based on the sample results in...Ch. 6.2 - Durations of Pregnancies The lengths of...Ch. 6.2 - Water Taxi Safety When a water taxi sank in...Ch. 6.2 - Large Data Sets. In Exercises 33 and 34, refer to...Ch. 6.2 - Large Data Sets. In Exercises 33 and 34, refer to...Ch. 6.2 - Curving Test Scores A professor gives a test and...Ch. 6.2 - Outliers For the purposes of constructing modified...Ch. 6.3 - Births There are about 11,000 births each day in...Ch. 6.3 - Sampling with Replacement The Orangetown Medical...Ch. 6.3 - Unbiased Estimators Data Set 4 Births in Appendix...Ch. 6.3 - Sampling Distribution Data Set 4 Births in...Ch. 6.3 - Good Sample? A geneticist is investigating the...Ch. 6.3 - College Presidents There are about 4200 college...Ch. 6.3 - In Exercises 710, use the same population of {4,...Ch. 6.3 - In Exercises 710, use the same population of {4,...Ch. 6.3 - In Exercises 710, use the same population of {4,...Ch. 6.3 - In Exercises 710, use the same population of {4,...Ch. 6.3 - In Exercises 1114, use the population of {34, 36,...Ch. 6.3 - In Exercises 1114, use the population of {34, 36,...Ch. 6.3 - In Exercises 1114, use the population of {34, 36,...Ch. 6.3 - In Exercises 1114, use the population of {34, 36,...Ch. 6.3 - Births: Sampling Distribution of Sample Proportion...Ch. 6.3 - Births: Sampling Distribution of Sample Proportion...Ch. 6.3 - SAT and ACT Tests Because they enable efficient...Ch. 6.3 - Hybridization A hybridization experiment begins...Ch. 6.3 - Using a Formula to Describe a Sampling...Ch. 6.3 - Mean Absolute Deviation Is the mean absolute...Ch. 6.4 - Requirements A researcher collects a simple random...Ch. 6.4 - Small Sample Weights of golden retriever dogs are...Ch. 6.4 - Notation In general, what do the symbols x and x...Ch. 6.4 - Annual Incomes Annual incomes are known to have a...Ch. 6.4 - Using the Central Limit Theorem. In Exercises 58,...Ch. 6.4 - Using the Central Limit Theorem. In Exercises 58,...Ch. 6.4 - Using the Central Limit Theorem. In Exercises 58,...Ch. 6.4 - Using the Central Limit Theorem. In Exercises 58,...Ch. 6.4 - Elevator Safety Example 2 referred to an elevator...Ch. 6.4 - Elevator Safety Exercise 9 uses = 189 lb, which...Ch. 6.4 - Mensa Membership in Mensa requires a score in the...Ch. 6.4 - Designing Manholes According to the website...Ch. 6.4 - Water Taxi Safety Passengers died when a water...Ch. 6.4 - Vending Machines Quarters are now manufactured so...Ch. 6.4 - Southwest Airlines Seats Southwest Airlines...Ch. 6.4 - Coke Cans Assume that cans of Coke are filled so...Ch. 6.4 - Redesign of Ejection Seats When women were finally...Ch. 6.4 - Loading a Tour Boat The Ethan Allen tour boat...Ch. 6.4 - Doorway Height The Boeing 757-200 ER airliner...Ch. 6.4 - Loading Aircraft Before every flight, the pilot...Ch. 6.4 - Correcting for a Finite Population In a study of...Ch. 6.5 - Normal Quantile Plot Data Set 1 Body Data in...Ch. 6.5 - Normal Quantile Plot After constructing a...Ch. 6.5 - Small Sample Data set 29 Coin Weights in Appendix...Ch. 6.5 - Assessing Normality The accompanying histogram is...Ch. 6.5 - Prob. 5BSCCh. 6.5 - Prob. 6BSCCh. 6.5 - Prob. 7BSCCh. 6.5 - Interpreting Normal Quantile Plots. In Exercises...Ch. 6.5 - Prob. 9BSCCh. 6.5 - Determining Normality. In Exercises 912, refer to...Ch. 6.5 - Determining Normality. In Exercises 912, refer to...Ch. 6.5 - Prob. 12BSCCh. 6.5 - Using Technology to Generate Normal Quantile...Ch. 6.5 - Using Technology to Generate Normal Quantile...Ch. 6.5 - Prob. 15BSCCh. 6.5 - Prob. 16BSCCh. 6.5 - Constructing Normal Quantile Plots. In Exercises...Ch. 6.5 - Prob. 18BSCCh. 6.5 - Constructing Normal Quantile Plots. In Exercises...Ch. 6.5 - Constructing Normal Quantile Plots. In Exercises...Ch. 6.5 - Transformations The heights (in inches) of men...Ch. 6.5 - Lognormal Distribution The following are the...Ch. 6.6 - Continuity Correction In testing the assumption...Ch. 6.6 - Checking Requirements Common tests such as the...Ch. 6.6 - Notation Common tests such as the SAT, ACT, LSAT,...Ch. 6.6 - Distribution of Proportions Each week, Nielsen...Ch. 6.6 - Using Normal Approximation. In Exercises 58, do...Ch. 6.6 - Using Normal Approximation. In Exercises 58, do...Ch. 6.6 - Using Normal Approximation. In Exercises 58, do...Ch. 6.6 - Using Normal Approximation. In Exercises 58, do...Ch. 6.6 - Car Colors. In Exercises 912, assume that 100 cars...Ch. 6.6 - Car Colors. In Exercises 912, assume that 100 cars...Ch. 6.6 - Car Colors. In Exercises 912, assume that 100 cars...Ch. 6.6 - Car Colors. In Exercises 912, assume that 100 cars...Ch. 6.6 - Tennis Replay In the year that this exercise was...Ch. 6.6 - Tennis Replay Repeat the preceding exercise after...Ch. 6.6 - Smartphones Based on an LG smartphone survey,...Ch. 6.6 - Eye Color Based on a study by Dr. P. Sorita at...Ch. 6.6 - Mendelian Genetics When Mendel conducted his...Ch. 6.6 - Sleepwalking Assume that 29.2% of people have...Ch. 6.6 - Voters Lying? In a survey of 1002 people, 701 said...Ch. 6.6 - Cell Phones and Brain Cancer In a study of 420,095...Ch. 6.6 - Births The probability of a baby being born a boy...Ch. 6.6 - Overbooking a Boeing 767-300 A Boeing 767-300...Ch. 6 - Bone Density Test. In Exercises 14, assume that...Ch. 6 - Bone Density Test. In Exercises 14, assume that...Ch. 6 - Bone Density Test. In Exercises 14, assume that...Ch. 6 - Bone Density Test. In Exercises 14, assume that...Ch. 6 - Notation a. Identify the values of and for the...Ch. 6 - In Exercises 610, assume that women have diastolic...Ch. 6 - In Exercises 610, assume that women have diastolic...Ch. 6 - In Exercises 610, assume that women have diastolic...Ch. 6 - In Exercises 610, assume that women have diastolic...Ch. 6 - In Exercises 610, assume that women have diastolic...Ch. 6 - Bone Density Test A bone mineral density test is...Ch. 6 - Biometric Security In designing a security system...Ch. 6 - Biometric Security Standing eye heights of men are...Ch. 6 - Sampling Distributions Scores on the Gilliam...Ch. 6 - Unbiased Estimators a. What is an unbiased...Ch. 6 - Disney Monorail The Mark VI monorail used at...Ch. 6 - Disney Monorail Consider the same Mark VI monorail...Ch. 6 - Assessing Normality Listed below are the recent...Ch. 6 - Hybridization Experiment In one of Mendels...Ch. 6 - Tall Clubs The social organization Tall Clubs...Ch. 6 - In Exercises 13, use the following recent annual...Ch. 6 - In Exercises 13, use the following recent annual...Ch. 6 - In Exercises 13, use the following recent annual...Ch. 6 - Blue Eyes Assume that 35% of us have blue eyes...Ch. 6 - Foot Lengths of Women Assume that foot lengths of...Ch. 6 - Assessing Normality It is often necessary to...Ch. 6 - Binomial Probabilities Section 6-6 described a...
Additional Math Textbook Solutions
Find more solutions based on key concepts
Vegetarians (Example 1) In 2016 a Harris poll estimated that 3.3 of American adults are vegetarian. A nutrition...
Introductory Statistics
Error Type. Distinguish between random errors and systematic errors. How can we minimize the effects of random ...
Statistical Reasoning for Everyday Life (5th Edition)
Explain the meaning of the term “statistically significant difference” in statistics terminology.
Intro Stats
Critical Thinking Challenge
1.40 20/20 survey exposé Refer to the “Statistics in Action” box of this chapter ...
Statistics for Business and Economics (13th Edition)
GSS and heaven Go to the General Social Survey website, http://sda.berkeley.edu/GSS. Enter HEAVEN as the row va...
Statistics: The Art and Science of Learning from Data (4th Edition)
Knowledge Booster


Learn more about
Need a deep-dive on the concept behind this application? Look no further. Learn more about this topic, statistics and related others by exploring similar questions and additional content below.Similar questions
- Urban Travel Times Population of cities and driving times are related, as shown in the accompanying table, which shows the 1960 population N, in thousands, for several cities, together with the average time T, in minutes, sent by residents driving to work. City Population N Driving time T Los Angeles 6489 16.8 Pittsburgh 1804 12.6 Washington 1808 14.3 Hutchinson 38 6.1 Nashville 347 10.8 Tallahassee 48 7.3 An analysis of these data, along with data from 17 other cities in the United States and Canada, led to a power model of average driving time as a function of population. a Construct a power model of driving time in minutes as a function of population measured in thousands b Is average driving time in Pittsburgh more or less than would be expected from its population? c If you wish to move to a smaller city to reduce your average driving time to work by 25, how much smaller should the city be?arrow_forwardHow strongly do physical characteristics of sisters and brothers correlate? The data in the table give the heights (in inches) of 1212 adult pairs. Brother 7171 6868 6666 6767 7070 7171 7070 7373 7272 6565 6666 7070 Sister 6969 6464 6565 6363 6565 6262 6565 6464 6666 5959 6262 6464 To access the data, click the link for your preferred software format. CSV Excel (xls) Excel (xlsx) JMP Mac-Text Minitab14-18 Minitab18+ PC-Text R SPSS TI CrunchIt! © Macmillan Learning Assume Damien is 6767 inches tall. Predict the height of his sister Tonya. Give your answer to one decimal place. Tonya's predicted height:arrow_forwardData Set Observation Cost (y) Sq Ft (x) 1 1375.45 932.57 2 1101.84 748.51 3 1117.36 802.89 4 1264.47 863.70 5 1153.78 820.81 6 1284.78 880.18 7 1347.72 889.99 8 1153.94 757.00 9 1227.91 832.32 10 940.92 636.79 11 1451.17 964.54 12 1227.46 787.09 13 1223.59 729.62 14 1299.92 824.61 15 1033.04 707.14 16 1332.67 847.91 17 1167.35 793.93 18 1424.59 1067.78 19 1212.05 963.85 20 730.11 600.31 21 1318.49 894.13 22 1004.32 710.19 23 1165.73 824.49 24 1304.73 866.44 25 1322.26 924.77 26 1171.99 822.70 27 1573.41 1007.63 28 1282.09 801.91 29 1568.79 882.75 30 1405.95 916.47 31 1294.61 858.52 32 1350.73 938.10 33 1304.96 882.32 34 1153.32 771.59 35 829.62 669.46 36 1529.05 1035.86 37 1260.27 789.55 38 1234.43 860.34 39 1409.90 906.32 40 1392.18 861.36 41 1248.01 759.53 42 1283.53 803.23 43 1031.28 837.51 44 1441.41 997.90 45 1237.03 763.92 46 1433.17 928.47 47 1322.78 880.86 48 1284.61…arrow_forward
- A. Directions: Analyze, interpret and make conclusion out of the given data.arrow_forwardSLR Assignment #18/19 The monthly rent of college apartments An agent for a property management company would like to be able to predict the monthly rental cost for apartments based on the size of the apartment as defined by square footage. A sample of 25 apartments rent in a particular college rental neighborhood was selected, and the information collected revealed the following: Apartment Monthly Rent ($) Size (Sq. Ft.) 1 950 850 2 1,600 1,450 3 1,200 1,085 4 1,500 1,232 5 950 718 6 1,700 1,485 7 1,650 1,136 8 935 726 9 875 700 10 1,150 956 11 1,400 1,100 12 1,650 1,285 13 2,300 1,985 14 1,800 1,369 15 1,400 1,175 16 1,450 1,225 17 1,100 1,245 18 1,700 1,259 19 1,200 1,150 20 1,150 896 21 1,600 1,361 22 1,650 1,040 23 1,200 755 24 800 1,000 25 1,750 1,200 A Minitab…arrow_forward6) part 4. Generate a abo plot for the asteroid data.arrow_forward
- Background: The Worcester heart attack data provided below contains the systolic blood pressures of patients hospitalized for acute myocardial infarction (heart attack). This data is a protion of a larger data set compiled by Dr. Robert J. Goldberg of the Department of Cardiology at the University of Massachusetts Medical School between 1975 and 2001. The Center for Disease Control and Prevention (CDC) recommends that people maintain a systolic blood pressure of less than 140 mmHg. Systolic 154 120 147 126 134 80 194 150 211 169 157 194 149 152 138 140 125 166 197 139 123 210 166 115 144 170 118 167 113 168 108 128 148 129 140 185 151 132 149 171 199 183 93 82 182 211 121 171 187 158 113 117 123 135 119 152 194 144 111 129 161 117 122 123 111 130 149 136 126 81 230 99 162 96 139 122 191 150 120 149 154 103 111 113…arrow_forwardRedo exercises 21 through 23 in section 8.2 of your textbook, about the three types of employment in a small town, using the following data:arrow_forwarda.) Develop a scatter diagram for the data b.) How would you characterize the relationship between fuel tank capacity and cruising rangearrow_forward
arrow_back_ios
arrow_forward_ios
Recommended textbooks for you
 Algebra: Structure And Method, Book 1AlgebraISBN:9780395977224Author:Richard G. Brown, Mary P. Dolciani, Robert H. Sorgenfrey, William L. ColePublisher:McDougal Littell
 Functions and Change: A Modeling Approach to Coll...AlgebraISBN:9781337111348Author:Bruce Crauder, Benny Evans, Alan NoellPublisher:Cengage Learning
 Big Ideas Math A Bridge To Success Algebra 1: Stu...AlgebraISBN:9781680331141Author:HOUGHTON MIFFLIN HARCOURTPublisher:Houghton Mifflin Harcourt
 Holt Mcdougal Larson Pre-algebra: Student Edition...AlgebraISBN:9780547587776Author:HOLT MCDOUGALPublisher:HOLT MCDOUGAL
Algebra: Structure And Method, Book 1
Algebra
ISBN:9780395977224
Author:Richard G. Brown, Mary P. Dolciani, Robert H. Sorgenfrey, William L. Cole
Publisher:McDougal Littell
Functions and Change: A Modeling Approach to Coll...
Algebra
ISBN:9781337111348
Author:Bruce Crauder, Benny Evans, Alan Noell
Publisher:Cengage Learning
Big Ideas Math A Bridge To Success Algebra 1: Stu...
Algebra
ISBN:9781680331141
Author:HOUGHTON MIFFLIN HARCOURT
Publisher:Houghton Mifflin Harcourt
Holt Mcdougal Larson Pre-algebra: Student Edition...
Algebra
ISBN:9780547587776
Author:HOLT MCDOUGAL
Publisher:HOLT MCDOUGAL
Correlation Vs Regression: Difference Between them with definition & Comparison Chart; Author: Key Differences;https://www.youtube.com/watch?v=Ou2QGSJVd0U;License: Standard YouTube License, CC-BY
Correlation and Regression: Concepts with Illustrative examples; Author: LEARN & APPLY : Lean and Six Sigma;https://www.youtube.com/watch?v=xTpHD5WLuoA;License: Standard YouTube License, CC-BY