College Algebra in Context with Applications for the Managerial, Life, and Social Sciences, Kent State University
17th Edition
ISBN: 9781323452806
Author: Harshbarger/yocco
Publisher: Pearson Education
expand_more
expand_more
format_list_bulleted
Concept explainers
Videos
Textbook Question
Chapter 6.2, Problem 18E
Use unrounded models for graphing and calculations unless otherwise stated. Report models with coefficients to three decimal places unless otherwise instructed.
18. Social Security Beneficiaries The table that follows gives the numbers of Social Security beneficiaries (in millions) for selected years from 1950 to 2000, with projections through 2030.
- a. Find the cubic equation that models the data, with x equal to the number of years after 1950 and B(x) equal to the number of millions of beneficiaries. Report the model with four decimal places.
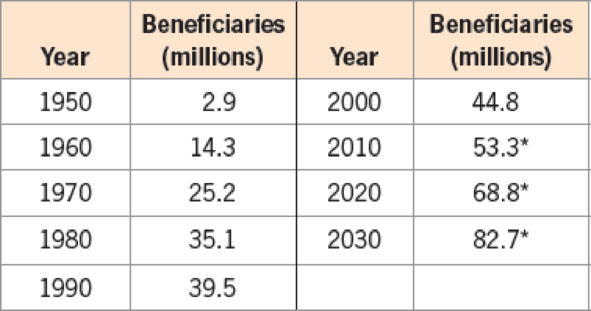
(Source: 2000 Social Security Trustees Report) * Projected.
- b. Graph the data points and the model on the same axes.
- c. Is the model a good fit for the data?
Expert Solution & Answer
Want to see the full answer?
Check out a sample textbook solution
Students have asked these similar questions
Suppose that a deer population grows logistically while being harvested at a rate proportional to the size of the population. The equation modelling this growth is
p′ =rp(1−p/K)−λp.
Explain the effects on the equilibrium deer population when λ is slowly increased from a small
value to a large value. Include a bifurcation diagram.
A manager wishes to predict the annual cost (y) of an automobile based on the number of miles (x) driven. The following model was developed: y = 1,550 + 0.36x.
If a car is driven 15,000 miles, the predicted cost is ____________.
. Elderly Men in the Workforce The table below givesthe percent of men 65 years or older in the workforcefor selected years from 1920 and projected to 2030.
a. With x = 0 representing 1900, find the cubicfunction that models the data.b. Use the model to determine when the percentof elderly men in the workforce reached itsminimum.
Chapter 6 Solutions
College Algebra in Context with Applications for the Managerial, Life, and Social Sciences, Kent State University
Ch. 6.1 - Graph the function h(x) = 3x3 + 5x2 x 10 on the...Ch. 6.1 - Graph the function f(x) = 2x3 3x2 6x on the...Ch. 6.1 - Prob. 3ECh. 6.1 - Prob. 4ECh. 6.1 - Prob. 5ECh. 6.1 - Prob. 6ECh. 6.1 - Prob. 7ECh. 6.1 - Prob. 8ECh. 6.1 - Prob. 9ECh. 6.1 - Prob. 10E
Ch. 6.1 - Prob. 11ECh. 6.1 - Prob. 12ECh. 6.1 - Prob. 13ECh. 6.1 - Prob. 14ECh. 6.1 - Prob. 15ECh. 6.1 - For Exercises 1116, match the polynomial function...Ch. 6.1 - For Exercises 1720, use the equation of the...Ch. 6.1 - Prob. 18ECh. 6.1 - Prob. 19ECh. 6.1 - Prob. 20ECh. 6.1 - Prob. 21ECh. 6.1 - Prob. 22ECh. 6.1 - Prob. 23ECh. 6.1 - Prob. 24ECh. 6.1 - Prob. 25ECh. 6.1 - Prob. 26ECh. 6.1 - Prob. 27ECh. 6.1 - Prob. 28ECh. 6.1 - Prob. 29ECh. 6.1 - Prob. 30ECh. 6.1 - Prob. 31ECh. 6.1 - Sketch a graph of any cubic polynomial function...Ch. 6.1 - Prob. 33ECh. 6.1 - Prob. 34ECh. 6.1 - Prob. 35ECh. 6.1 - Prob. 36ECh. 6.1 - Prob. 37ECh. 6.1 - Prob. 38ECh. 6.1 - Daily Revenue The daily revenue in dollars from...Ch. 6.1 - Prob. 40ECh. 6.1 - Prob. 41ECh. 6.1 - Prob. 42ECh. 6.1 - Starbucks Using data from 2005 and projected to...Ch. 6.1 - Prob. 44ECh. 6.1 - Prob. 45ECh. 6.1 - Prob. 46ECh. 6.1 - Prob. 47ECh. 6.1 - Salaries The median salary for male workers, in...Ch. 6.1 - Prob. 49ECh. 6.1 - Prob. 50ECh. 6.2 - Find the cubic function that models the data in...Ch. 6.2 - Find the cubic function that is the best fit for...Ch. 6.2 - Prob. 3ECh. 6.2 - Find the quartic function that is the best fit for...Ch. 6.2 - Prob. 5ECh. 6.2 - a. Make a scatter plot of the data in the table...Ch. 6.2 - Prob. 7ECh. 6.2 - a. Find a cubic function that models the data in...Ch. 6.2 - Prob. 9ECh. 6.2 - a. Graph each of the functions found in Exercise 9...Ch. 6.2 - Prob. 11ECh. 6.2 - Prob. 12ECh. 6.2 - Prob. 13ECh. 6.2 - Prob. 14ECh. 6.2 - Prob. 15ECh. 6.2 - Find the cubic function that is the best fit for...Ch. 6.2 - Use unrounded models for graphing and calculations...Ch. 6.2 - Use unrounded models for graphing and calculations...Ch. 6.2 - Prob. 19ECh. 6.2 - Prob. 20ECh. 6.2 - Median Age at First Marriage (Source: U.S. Census...Ch. 6.2 - Prob. 22ECh. 6.2 - Prob. 23ECh. 6.2 - Inflation Rate The annual changes in the consumer...Ch. 6.2 - Elderly Men in the Workforce The table below gives...Ch. 6.2 - Prob. 26ECh. 6.2 - Prob. 27ECh. 6.2 - Consumer Prices The data in the table give the...Ch. 6.2 - Federal Tax Per Capita The table gives the amount...Ch. 6.2 - Japanese Economy The economy of Japan is the third...Ch. 6.2 - Women in the Workforce The following table gives...Ch. 6.2 - Homicide Rates The table gives the U.S. homicide...Ch. 6.2 - Prob. 33ECh. 6.2 - Prob. 34ECh. 6.2 - Prob. 35ECh. 6.2 - Union Membership The table on the next page gives...Ch. 6.2 - Prob. 37ECh. 6.2 - Medicaid The numbers of thousands of people...Ch. 6.3 - Prob. 1ECh. 6.3 - Prob. 2ECh. 6.3 - Prob. 3ECh. 6.3 - Prob. 4ECh. 6.3 - Prob. 5ECh. 6.3 - Prob. 6ECh. 6.3 - Prob. 7ECh. 6.3 - Prob. 8ECh. 6.3 - Prob. 9ECh. 6.3 - Prob. 10ECh. 6.3 - Prob. 11ECh. 6.3 - Prob. 12ECh. 6.3 - Prob. 13ECh. 6.3 - Prob. 14ECh. 6.3 - Prob. 15ECh. 6.3 - Prob. 16ECh. 6.3 - Prob. 17ECh. 6.3 - Prob. 18ECh. 6.3 - Prob. 19ECh. 6.3 - Prob. 20ECh. 6.3 - Prob. 21ECh. 6.3 - Prob. 22ECh. 6.3 - Prob. 23ECh. 6.3 - Prob. 24ECh. 6.3 - Prob. 25ECh. 6.3 - Prob. 26ECh. 6.3 - Prob. 27ECh. 6.3 - Prob. 28ECh. 6.3 - Prob. 29ECh. 6.3 - Prob. 30ECh. 6.3 - Prob. 31ECh. 6.3 - Prob. 32ECh. 6.3 - Prob. 33ECh. 6.3 - Prob. 34ECh. 6.3 - Prob. 35ECh. 6.3 - Prob. 36ECh. 6.3 - Prob. 37ECh. 6.3 - Prob. 38ECh. 6.3 - Constructing a Box A box can be formed by cutting...Ch. 6.3 - Prob. 40ECh. 6.3 - Prob. 41ECh. 6.3 - Prob. 42ECh. 6.3 - Prob. 43ECh. 6.3 - Prob. 44ECh. 6.3 - Prob. 45ECh. 6.3 - Prob. 46ECh. 6.3 - Prob. 47ECh. 6.3 - Prob. 48ECh. 6.3 - Prob. 49ECh. 6.3 - Prob. 50ECh. 6.4 - In Exercises 14, use synthetic division to find...Ch. 6.4 - Prob. 2ECh. 6.4 - Prob. 3ECh. 6.4 - Prob. 4ECh. 6.4 - Prob. 5ECh. 6.4 - Prob. 6ECh. 6.4 - Prob. 7ECh. 6.4 - Prob. 8ECh. 6.4 - Prob. 9ECh. 6.4 - Prob. 10ECh. 6.4 - Prob. 11ECh. 6.4 - Prob. 12ECh. 6.4 - Prob. 13ECh. 6.4 - Prob. 14ECh. 6.4 - In Exercises 1316, find one solution graphically...Ch. 6.4 - Prob. 16ECh. 6.4 - Prob. 17ECh. 6.4 - Prob. 18ECh. 6.4 - Prob. 19ECh. 6.4 - Prob. 20ECh. 6.4 - Prob. 21ECh. 6.4 - Prob. 22ECh. 6.4 - Prob. 23ECh. 6.4 - In Exercises 2124, find all rational zeros of the...Ch. 6.4 - Prob. 25ECh. 6.4 - Prob. 26ECh. 6.4 - Prob. 27ECh. 6.4 - Solve each of the equations in Exercises 2530...Ch. 6.4 - Prob. 29ECh. 6.4 - Prob. 30ECh. 6.4 - Prob. 31ECh. 6.4 - In Exercises 3136, use synthetic division and...Ch. 6.4 - Prob. 33ECh. 6.4 - Prob. 34ECh. 6.4 - Prob. 35ECh. 6.4 - Prob. 36ECh. 6.4 - Drunk Driving Crashes Suppose the total number of...Ch. 6.4 - Prob. 38ECh. 6.4 - Prob. 39ECh. 6.4 - Births The number of births to females in the...Ch. 6.4 - Prob. 41ECh. 6.4 - Personal Savings The model y = 0.000447x3 ...Ch. 6.5 - Give the equations of any (a) vertical and (b)...Ch. 6.5 - Prob. 2ECh. 6.5 - Prob. 3ECh. 6.5 - Prob. 4ECh. 6.5 - Prob. 5ECh. 6.5 - Prob. 6ECh. 6.5 - Prob. 7ECh. 6.5 - Prob. 8ECh. 6.5 - Prob. 9ECh. 6.5 - Prob. 10ECh. 6.5 - Prob. 11ECh. 6.5 - Prob. 12ECh. 6.5 - Prob. 13ECh. 6.5 - Prob. 14ECh. 6.5 - Prob. 15ECh. 6.5 - Prob. 16ECh. 6.5 - Prob. 17ECh. 6.5 - Prob. 18ECh. 6.5 - Prob. 19ECh. 6.5 - Prob. 20ECh. 6.5 - Prob. 21ECh. 6.5 - Prob. 22ECh. 6.5 - Prob. 23ECh. 6.5 - Prob. 24ECh. 6.5 - Prob. 25ECh. 6.5 - Prob. 26ECh. 6.5 - Prob. 27ECh. 6.5 - Prob. 28ECh. 6.5 - Prob. 29ECh. 6.5 - Prob. 30ECh. 6.5 - Prob. 31ECh. 6.5 - Prob. 32ECh. 6.5 - Prob. 33ECh. 6.5 - Prob. 34ECh. 6.5 - Prob. 35ECh. 6.5 - Prob. 36ECh. 6.5 - Prob. 37ECh. 6.5 - Prob. 38ECh. 6.5 - Prob. 39ECh. 6.5 - Prob. 40ECh. 6.5 - Prob. 41ECh. 6.5 - Average Cost The average cost per unit for the...Ch. 6.5 - Prob. 43ECh. 6.5 - Prob. 44ECh. 6.5 - Prob. 45ECh. 6.5 - Prob. 46ECh. 6.5 - Prob. 47ECh. 6.5 - Prob. 48ECh. 6.5 - Prob. 49ECh. 6.5 - Prob. 50ECh. 6.5 - Prob. 51ECh. 6.5 - Prob. 52ECh. 6.5 - Prob. 53ECh. 6.5 - Prob. 54ECh. 6.5 - Age at First Marriage The table that follows shows...Ch. 6.5 - Fences Suppose that a rectangular field is to have...Ch. 6.5 - Prob. 57ECh. 6.5 - Prob. 58ECh. 6.6 - Prob. 1ECh. 6.6 - Prob. 2ECh. 6.6 - Prob. 3ECh. 6.6 - Prob. 4ECh. 6.6 - In Exercises 116, use algebraic and/or graphical...Ch. 6.6 - Prob. 6ECh. 6.6 - Prob. 7ECh. 6.6 - Prob. 8ECh. 6.6 - Prob. 9ECh. 6.6 - Prob. 10ECh. 6.6 - Prob. 11ECh. 6.6 - Prob. 12ECh. 6.6 - Prob. 13ECh. 6.6 - Prob. 14ECh. 6.6 - Prob. 15ECh. 6.6 - Prob. 16ECh. 6.6 - For Exercises 1720, use the graph of y = f(x) to...Ch. 6.6 - Prob. 18ECh. 6.6 - Prob. 19ECh. 6.6 - Prob. 20ECh. 6.6 - Prob. 21ECh. 6.6 - Prob. 22ECh. 6.6 - Prob. 23ECh. 6.6 - Prob. 24ECh. 6.6 - Prob. 25ECh. 6.6 - Combine factoring with graphical and/or numerical...Ch. 6.6 - Prob. 27ECh. 6.6 - 28. Average Cost The average cost per set for the...Ch. 6.6 - Prob. 29ECh. 6.6 - Prob. 30ECh. 6.6 - Prob. 31ECh. 6.6 - Prob. 32ECh. 6.6 - Prob. 33ECh. 6.6 - Prob. 34ECh. 6.6 - Population Suppose the number of employees of a...Ch. 6 - For Exercises 14, (a) give the degree of the...Ch. 6 - For Exercises 14, (a) give the degree of the...Ch. 6 - Prob. 3TECh. 6 - Prob. 4TECh. 6 - Prob. 5TECh. 6 - Prob. 6TECh. 6 - Prob. 7TECh. 6 - Prob. 8TECh. 6 - Prob. 9TECh. 6 - Prob. 10TECh. 6 - Prob. 11TECh. 6 - Prob. 12TECh. 6 - Prob. 13TECh. 6 - Prob. 14TECh. 6 - In Exercises 1116, simplify each rational...Ch. 6 - Prob. 16TECh. 6 - Prob. 17TECh. 6 - Prob. 18TECh. 6 - Prob. 19TECh. 6 - Prob. 20TECh. 6 - Prob. 21TECh. 6 - Prob. 22TECh. 6 - Prob. 23TECh. 6 - Prob. 24TECh. 6 - Prob. 25TECh. 6 - Prob. 26TECh. 6 - Prob. 27TECh. 6 - Prob. 28TECh. 6 - Prob. 29TECh. 6 - Prob. 30TECh. 6 - Prob. 31TECh. 6 - Prob. 32TECh. 6 - Prob. 33TECh. 6 - Prob. 34TECh. 6 - Prob. 35TECh. 6 - Prob. 36TECh. 6 - Prob. 37TECh. 6 - Prob. 38TECh. 6 - Prob. 39TECh. 6 - Prob. 40TECh. 6 - In Exercises 3841, perform the long division. 41....Ch. 6 - Prob. 1RECh. 6 - Prob. 2RECh. 6 - Prob. 3RECh. 6 - Prob. 4RECh. 6 - Prob. 5RECh. 6 - Prob. 6RECh. 6 - Prob. 7RECh. 6 - Prob. 8RECh. 6 - Solve x4 x3 20x2 = 0.Ch. 6 - Prob. 10RECh. 6 - Prob. 11RECh. 6 - Prob. 12RECh. 6 - Prob. 13RECh. 6 - Prob. 14RECh. 6 - Prob. 15RECh. 6 - Prob. 16RECh. 6 - Prob. 17RECh. 6 - Prob. 18RECh. 6 - Find one solution of 3x3 x2 12x + 4 = 0...Ch. 6 - Find one solution of 2x3 + 5x2 4x 3 = 0...Ch. 6 - Prob. 21RECh. 6 - Prob. 22RECh. 6 - Prob. 23RECh. 6 - Prob. 24RECh. 6 - Prob. 25RECh. 6 - Prob. 26RECh. 6 - Prob. 27RECh. 6 - Prob. 28RECh. 6 - Prob. 29RECh. 6 - Prob. 30RECh. 6 - Prob. 31RECh. 6 - Prob. 32RECh. 6 - Prob. 33RECh. 6 - Revenue The monthly revenue for a product is given...Ch. 6 - Prob. 35RECh. 6 - Prob. 36RECh. 6 - Prob. 37RECh. 6 - Prob. 38RECh. 6 - Foreign Born Population The table on the following...Ch. 6 - Prob. 40RECh. 6 - Prob. 41RECh. 6 - Break-Even The daily profit in dollars for a...Ch. 6 - Starbucks The table gives the total number of...Ch. 6 - Drugs in the Bloodstream The concentration of a...Ch. 6 - Prob. 45RECh. 6 - Prob. 46RECh. 6 - Prob. 47RECh. 6 - Prob. 48RECh. 6 - Prob. 49RECh. 6 - Prob. 50RECh. 6 - Prob. 51RECh. 6 - Prob. 52RECh. 6 - Prob. 53RECh. 6 - Cost-Benefit The percent p of particulate...
Knowledge Booster


Learn more about
Need a deep-dive on the concept behind this application? Look no further. Learn more about this topic, subject and related others by exploring similar questions and additional content below.Similar questions
- #14 Bob & Tom host a radio show. To model the quantity of people watching the show throughout the morning hours, an equation of best fit in the form y=ab^x is modeled from the below data. y= 522,168.6118(0.9491)^x What is the meaning of parameter b in this equation? Number of hours past midnight (Time of day) (left side) Quantity of people tuned in (right side) 5 420,000 6 378,000 8 320,000 11 305,000arrow_forwardThe shiver-me-Timbers tree farms has 7,800 lumber-quality fast growing trees that are ready to be harvested. The company has a strategy that each year it will harvest 12% of the trees and plant 660 lumber-quality trees during the year. Let n represent the number of years and Yn represent the number of lumber-quality trees on the farm at the end of the year. A) Form the difference equation and initial value that models the timber company's strategy where Yn represent the number of lumber-quality trees on the farm at the end of the year and Yn-1 represent the number of lumber-quality trees on the farm at the end of the previous year. B) solve the difference equation. C) use the solution of the difference equation to find Y36. D) Interpret the results for part c. E) According to the difference equation model, will the tree farm ever reach a point in the future when you have no trees harvest?arrow_forwardA company is considering to start harvesting salmon in a new region. They model the salmon population size in that region by the equation P′(t) = kP(t) − h, with the natural growth rate of k = 2 salmon per year per population and a harvest rate h salmon per year. The company wants to decide how much salmon to harvest per year. The company estimates that currently there is 1mil salmon in that region. in each of the following four choices of harvest rate , determine what eventually happens to the population of salmon based on this model: 1) h= 500,000 2)h= 1 mil. 3) h= 2 mil 4) h= 3 milarrow_forward
- Using Social Security Administration data for selected years from 2012 and projected to 2050, the U.S. consumer price index (CPI) can be described by the equation C = 0.068 + 1.8t + 96 where t is the number of years past 2010. With 2012 as the reference year, a year in which the CPI = 120.56 means goods and services that cost $100.00 in 2012 are expected to cost $120.56 in that year. Find the year in which the CPI is predicted to reach 150.00.arrow_forwardA company is considering to start harvesting salmon in a new region. They model the salmon population size in that region by the equation P′(t) = kP(t) − h, with the natural growth rate of k = 2 salmon per year per population and a harvest rate h salmon per year. The company wants to decide how much salmon to harvest per year. The company estimates that currently there is 1mil salmon in that region. determine the maximal sustainable harvest ratearrow_forwardYour pet hamster eats 16 grams of food every 2 days. You fill its feeding bowl on day zero with 73 grams of food. a.Find a linear model/formula for the hamster's eating habit. Round decimals to at least 3 places. b.arrow_forward
- The estimated Philippine population is 90 million in 2010 and the estimated growth rate was 2.4 % per year. That is n(2010) = 9 x10⁷ and k= 0.024. So an equation for predicting the population with the stated initial condition and growth rate of 2010 isarrow_forward12. The amount of heat H (in joules) required to convert one gram of water into vapor is linearly related to thetemperature T (in ?? ) of the atmosphere. At 10?? this conversion requires 2480 joules, and each increasein temperature of 15?? lowers the amount of heat needed by 40 joules. Express H in term of T.arrow_forwardS. lactis is a bacteria that can quadruple every 160 minutes when grown in a lactose broth under ideal circumstances. If a sample of 15 of these bacteria is allowed to grow in these ideal circumstances, answer the following. (a) Find an equation for a model for the number of bacteria S after n 160-minute intervals have passed. = (b) Estimate the number of bacteria present after 8 hours. bacteriaarrow_forward
- About the size of New Jersey, Israel has seen its population soar to more than 6 million since it was established. The given graphs show that by 2050, Palestinians in the West Bank, Gaza Strip, and East Jerusalem will outnumber Israelis. Solve the projected growth of these two populations as given below, a. In 2000, the population of the Palestinians in the West Bank, Gaza Strip, and East Jerusalem was approximately 3.2 million and by 2050 it is projected to grow to 12 million. Use the exponential growth model A = A0ekt, in which t is the number of years after 2000, to find the exponentialgrowth function that models the data. b. In which year will the Palestinian population be 9 million?arrow_forwardA company is considering to start harvesting salmon in a new region. They model the salmon population size in that region by the equation P′(t) = kP(t) − h, with the natural growth rate of k = 2 salmon per year per population and a harvest rate h salmon per year. The company wants to decide how much salmon to harvest per year. The company estimates that currently there is 1mil salmon in that region.arrow_forwardIn 1993, the moose population in a park was measured to be 3200. By 1996, the population was measured again to be 2100. If the population continues to change linearly: Find a formula for yhe moose pupulation, P,in terms of t, the years since 1990. P(t)= what does your model predict the moose population to be in 2009?arrow_forward
arrow_back_ios
SEE MORE QUESTIONS
arrow_forward_ios
Recommended textbooks for you
 Algebra & Trigonometry with Analytic GeometryAlgebraISBN:9781133382119Author:SwokowskiPublisher:Cengage
Algebra & Trigonometry with Analytic Geometry
Algebra
ISBN:9781133382119
Author:Swokowski
Publisher:Cengage
Use of ALGEBRA in REAL LIFE; Author: Fast and Easy Maths !;https://www.youtube.com/watch?v=9_PbWFpvkDc;License: Standard YouTube License, CC-BY
Compound Interest Formula Explained, Investment, Monthly & Continuously, Word Problems, Algebra; Author: The Organic Chemistry Tutor;https://www.youtube.com/watch?v=P182Abv3fOk;License: Standard YouTube License, CC-BY
Applications of Algebra (Digit, Age, Work, Clock, Mixture and Rate Problems); Author: EngineerProf PH;https://www.youtube.com/watch?v=Y8aJ_wYCS2g;License: Standard YouTube License, CC-BY