
College Algebra in Context with Applications for the Managerial Life and Social Sciences (5th Edition)
5th Edition
ISBN: 9780134462295
Author: HARSHBARGER
Publisher: PEARSON
expand_more
expand_more
format_list_bulleted
Videos
Textbook Question
Chapter 6.2, Problem 28E
Consumer Prices The data in the table give the consumer price index (CPI) for selected years from 1945 to 2009.
- a. Create a
scatter plot of the data, with x equal to the number of years after 1945.
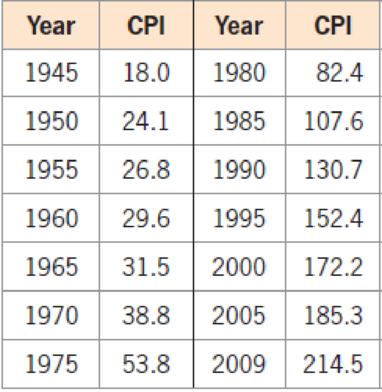
(Source: Bureau of Labor Statistics)
- b. What type of function would be best to model the in data? Find the equation of that function. Round the coefficient of the cubic term to five decimal places.
- c. Use the function to estimate the CPI in 2015.
Expert Solution & Answer
Want to see the full answer?
Check out a sample textbook solution
Students have asked these similar questions
. Consumer Prices The data in the table give the consumer price index (CPI) for selected years from 1945to 2009.a. Create a scatter plot of the data, with x equal tothe number of years after 1945.
b. What type of function would be best to model thedata? Find the equation of that function. Roundthe coefficient of the cubic term to five decimalplaces.c. Use the function to estimate the CPI in 2015.
An aerobic exercise instructor submitted to the shipping company the
data given in the following table, which shows the recommended
maximum exercise heart rates for individuals of the given ages. See
table below. If the Chief engineer is 40 years old, predict his maximum
exercise heart rate. If your answer has decimal point round it off to two
decimal places. Do not put space, comma or unit in your answer.
Age (x years)
Maximum heart rate(y
beats per minute)
20
40
60
170
153
136
Pls help. Pls do all parts pls i beg.
Chapter 6 Solutions
College Algebra in Context with Applications for the Managerial Life and Social Sciences (5th Edition)
Ch. 6.1 - Graph the function h(x) = 3x3 + 5x2 x 10 on the...Ch. 6.1 - Graph the function f(x) = 2x3 3x2 6x on the...Ch. 6.1 - Prob. 3ECh. 6.1 - Prob. 4ECh. 6.1 - Prob. 5ECh. 6.1 - Prob. 6ECh. 6.1 - Prob. 7ECh. 6.1 - Prob. 8ECh. 6.1 - Prob. 9ECh. 6.1 - Prob. 10E
Ch. 6.1 - Prob. 11ECh. 6.1 - Prob. 12ECh. 6.1 - Prob. 13ECh. 6.1 - Prob. 14ECh. 6.1 - Prob. 15ECh. 6.1 - For Exercises 1116, match the polynomial function...Ch. 6.1 - For Exercises 1720, use the equation of the...Ch. 6.1 - Prob. 18ECh. 6.1 - Prob. 19ECh. 6.1 - Prob. 20ECh. 6.1 - Prob. 21ECh. 6.1 - Prob. 22ECh. 6.1 - Prob. 23ECh. 6.1 - Prob. 24ECh. 6.1 - Prob. 25ECh. 6.1 - Prob. 26ECh. 6.1 - Prob. 27ECh. 6.1 - Prob. 28ECh. 6.1 - Prob. 29ECh. 6.1 - Prob. 30ECh. 6.1 - Prob. 31ECh. 6.1 - Sketch a graph of any cubic polynomial function...Ch. 6.1 - Prob. 33ECh. 6.1 - Prob. 34ECh. 6.1 - Prob. 35ECh. 6.1 - Prob. 36ECh. 6.1 - Prob. 37ECh. 6.1 - Prob. 38ECh. 6.1 - Daily Revenue The daily revenue in dollars from...Ch. 6.1 - Prob. 40ECh. 6.1 - Prob. 41ECh. 6.1 - Prob. 42ECh. 6.1 - Starbucks Using data from 2005 and projected to...Ch. 6.1 - Prob. 44ECh. 6.1 - Prob. 45ECh. 6.1 - Prob. 46ECh. 6.1 - Prob. 47ECh. 6.1 - Salaries The median salary for male workers, in...Ch. 6.1 - Prob. 49ECh. 6.1 - Prob. 50ECh. 6.2 - Find the cubic function that models the data in...Ch. 6.2 - Find the cubic function that is the best fit for...Ch. 6.2 - Prob. 3ECh. 6.2 - Find the quartic function that is the best fit for...Ch. 6.2 - Prob. 5ECh. 6.2 - a. Make a scatter plot of the data in the table...Ch. 6.2 - Prob. 7ECh. 6.2 - a. Find a cubic function that models the data in...Ch. 6.2 - Prob. 9ECh. 6.2 - a. Graph each of the functions found in Exercise 9...Ch. 6.2 - Prob. 11ECh. 6.2 - Prob. 12ECh. 6.2 - Prob. 13ECh. 6.2 - Prob. 14ECh. 6.2 - Prob. 15ECh. 6.2 - Find the cubic function that is the best fit for...Ch. 6.2 - Use unrounded models for graphing and calculations...Ch. 6.2 - Use unrounded models for graphing and calculations...Ch. 6.2 - Prob. 19ECh. 6.2 - Prob. 20ECh. 6.2 - Median Age at First Marriage (Source: U.S. Census...Ch. 6.2 - Prob. 22ECh. 6.2 - Prob. 23ECh. 6.2 - Inflation Rate The annual changes in the consumer...Ch. 6.2 - Elderly Men in the Workforce The table below gives...Ch. 6.2 - Prob. 26ECh. 6.2 - Prob. 27ECh. 6.2 - Consumer Prices The data in the table give the...Ch. 6.2 - Federal Tax Per Capita The table gives the amount...Ch. 6.2 - Japanese Economy The economy of Japan is the third...Ch. 6.2 - Women in the Workforce The following table gives...Ch. 6.2 - Homicide Rates The table gives the U.S. homicide...Ch. 6.2 - Prob. 33ECh. 6.2 - Prob. 34ECh. 6.2 - Prob. 35ECh. 6.2 - Union Membership The table on the next page gives...Ch. 6.2 - Prob. 37ECh. 6.2 - Medicaid The numbers of thousands of people...Ch. 6.3 - Prob. 1ECh. 6.3 - Prob. 2ECh. 6.3 - Prob. 3ECh. 6.3 - Prob. 4ECh. 6.3 - Prob. 5ECh. 6.3 - Prob. 6ECh. 6.3 - Prob. 7ECh. 6.3 - Prob. 8ECh. 6.3 - Prob. 9ECh. 6.3 - Prob. 10ECh. 6.3 - Prob. 11ECh. 6.3 - Prob. 12ECh. 6.3 - Prob. 13ECh. 6.3 - Prob. 14ECh. 6.3 - Prob. 15ECh. 6.3 - Prob. 16ECh. 6.3 - Prob. 17ECh. 6.3 - Prob. 18ECh. 6.3 - Prob. 19ECh. 6.3 - Prob. 20ECh. 6.3 - Prob. 21ECh. 6.3 - Prob. 22ECh. 6.3 - Prob. 23ECh. 6.3 - Prob. 24ECh. 6.3 - Prob. 25ECh. 6.3 - Prob. 26ECh. 6.3 - Prob. 27ECh. 6.3 - Prob. 28ECh. 6.3 - Prob. 29ECh. 6.3 - Prob. 30ECh. 6.3 - Prob. 31ECh. 6.3 - Prob. 32ECh. 6.3 - Prob. 33ECh. 6.3 - Prob. 34ECh. 6.3 - Prob. 35ECh. 6.3 - Prob. 36ECh. 6.3 - Prob. 37ECh. 6.3 - Prob. 38ECh. 6.3 - Constructing a Box A box can be formed by cutting...Ch. 6.3 - Prob. 40ECh. 6.3 - Prob. 41ECh. 6.3 - Prob. 42ECh. 6.3 - Prob. 43ECh. 6.3 - Prob. 44ECh. 6.3 - Prob. 45ECh. 6.3 - Prob. 46ECh. 6.3 - Prob. 47ECh. 6.3 - Prob. 48ECh. 6.3 - Prob. 49ECh. 6.3 - Prob. 50ECh. 6.4 - In Exercises 14, use synthetic division to find...Ch. 6.4 - Prob. 2ECh. 6.4 - Prob. 3ECh. 6.4 - Prob. 4ECh. 6.4 - Prob. 5ECh. 6.4 - Prob. 6ECh. 6.4 - Prob. 7ECh. 6.4 - Prob. 8ECh. 6.4 - Prob. 9ECh. 6.4 - Prob. 10ECh. 6.4 - Prob. 11ECh. 6.4 - Prob. 12ECh. 6.4 - Prob. 13ECh. 6.4 - Prob. 14ECh. 6.4 - In Exercises 1316, find one solution graphically...Ch. 6.4 - Prob. 16ECh. 6.4 - Prob. 17ECh. 6.4 - Prob. 18ECh. 6.4 - Prob. 19ECh. 6.4 - Prob. 20ECh. 6.4 - Prob. 21ECh. 6.4 - Prob. 22ECh. 6.4 - Prob. 23ECh. 6.4 - In Exercises 2124, find all rational zeros of the...Ch. 6.4 - Prob. 25ECh. 6.4 - Prob. 26ECh. 6.4 - Prob. 27ECh. 6.4 - Solve each of the equations in Exercises 2530...Ch. 6.4 - Prob. 29ECh. 6.4 - Prob. 30ECh. 6.4 - Prob. 31ECh. 6.4 - In Exercises 3136, use synthetic division and...Ch. 6.4 - Prob. 33ECh. 6.4 - Prob. 34ECh. 6.4 - Prob. 35ECh. 6.4 - Prob. 36ECh. 6.4 - Drunk Driving Crashes Suppose the total number of...Ch. 6.4 - Prob. 38ECh. 6.4 - Prob. 39ECh. 6.4 - Births The number of births to females in the...Ch. 6.4 - Prob. 41ECh. 6.4 - Personal Savings The model y = 0.000447x3 ...Ch. 6.5 - Give the equations of any (a) vertical and (b)...Ch. 6.5 - Prob. 2ECh. 6.5 - Prob. 3ECh. 6.5 - Prob. 4ECh. 6.5 - Prob. 5ECh. 6.5 - Prob. 6ECh. 6.5 - Prob. 7ECh. 6.5 - Prob. 8ECh. 6.5 - Prob. 9ECh. 6.5 - Prob. 10ECh. 6.5 - Prob. 11ECh. 6.5 - Prob. 12ECh. 6.5 - Prob. 13ECh. 6.5 - Prob. 14ECh. 6.5 - Prob. 15ECh. 6.5 - Prob. 16ECh. 6.5 - Prob. 17ECh. 6.5 - Prob. 18ECh. 6.5 - Prob. 19ECh. 6.5 - Prob. 20ECh. 6.5 - Prob. 21ECh. 6.5 - Prob. 22ECh. 6.5 - Prob. 23ECh. 6.5 - Prob. 24ECh. 6.5 - Prob. 25ECh. 6.5 - Prob. 26ECh. 6.5 - Prob. 27ECh. 6.5 - Prob. 28ECh. 6.5 - Prob. 29ECh. 6.5 - Prob. 30ECh. 6.5 - Prob. 31ECh. 6.5 - Prob. 32ECh. 6.5 - Prob. 33ECh. 6.5 - Prob. 34ECh. 6.5 - Prob. 35ECh. 6.5 - Prob. 36ECh. 6.5 - Prob. 37ECh. 6.5 - Prob. 38ECh. 6.5 - Prob. 39ECh. 6.5 - Prob. 40ECh. 6.5 - Prob. 41ECh. 6.5 - Average Cost The average cost per unit for the...Ch. 6.5 - Prob. 43ECh. 6.5 - Prob. 44ECh. 6.5 - Prob. 45ECh. 6.5 - Prob. 46ECh. 6.5 - Prob. 47ECh. 6.5 - Prob. 48ECh. 6.5 - Prob. 49ECh. 6.5 - Prob. 50ECh. 6.5 - Prob. 51ECh. 6.5 - Prob. 52ECh. 6.5 - Prob. 53ECh. 6.5 - Prob. 54ECh. 6.5 - Age at First Marriage The table that follows shows...Ch. 6.5 - Fences Suppose that a rectangular field is to have...Ch. 6.5 - Prob. 57ECh. 6.5 - Prob. 58ECh. 6.6 - Prob. 1ECh. 6.6 - Prob. 2ECh. 6.6 - Prob. 3ECh. 6.6 - Prob. 4ECh. 6.6 - In Exercises 116, use algebraic and/or graphical...Ch. 6.6 - Prob. 6ECh. 6.6 - Prob. 7ECh. 6.6 - Prob. 8ECh. 6.6 - Prob. 9ECh. 6.6 - Prob. 10ECh. 6.6 - Prob. 11ECh. 6.6 - Prob. 12ECh. 6.6 - Prob. 13ECh. 6.6 - Prob. 14ECh. 6.6 - Prob. 15ECh. 6.6 - Prob. 16ECh. 6.6 - For Exercises 1720, use the graph of y = f(x) to...Ch. 6.6 - Prob. 18ECh. 6.6 - Prob. 19ECh. 6.6 - Prob. 20ECh. 6.6 - Prob. 21ECh. 6.6 - Prob. 22ECh. 6.6 - Prob. 23ECh. 6.6 - Prob. 24ECh. 6.6 - Prob. 25ECh. 6.6 - Combine factoring with graphical and/or numerical...Ch. 6.6 - Prob. 27ECh. 6.6 - 28. Average Cost The average cost per set for the...Ch. 6.6 - Prob. 29ECh. 6.6 - Prob. 30ECh. 6.6 - Prob. 31ECh. 6.6 - Prob. 32ECh. 6.6 - Prob. 33ECh. 6.6 - Prob. 34ECh. 6.6 - Population Suppose the number of employees of a...Ch. 6 - For Exercises 14, (a) give the degree of the...Ch. 6 - For Exercises 14, (a) give the degree of the...Ch. 6 - Prob. 3TECh. 6 - Prob. 4TECh. 6 - Prob. 5TECh. 6 - Prob. 6TECh. 6 - Prob. 7TECh. 6 - Prob. 8TECh. 6 - Prob. 9TECh. 6 - Prob. 10TECh. 6 - Prob. 11TECh. 6 - Prob. 12TECh. 6 - Prob. 13TECh. 6 - Prob. 14TECh. 6 - In Exercises 1116, simplify each rational...Ch. 6 - Prob. 16TECh. 6 - Prob. 17TECh. 6 - Prob. 18TECh. 6 - Prob. 19TECh. 6 - Prob. 20TECh. 6 - Prob. 21TECh. 6 - Prob. 22TECh. 6 - Prob. 23TECh. 6 - Prob. 24TECh. 6 - Prob. 25TECh. 6 - Prob. 26TECh. 6 - Prob. 27TECh. 6 - Prob. 28TECh. 6 - Prob. 29TECh. 6 - Prob. 30TECh. 6 - Prob. 31TECh. 6 - Prob. 32TECh. 6 - Prob. 33TECh. 6 - Prob. 34TECh. 6 - Prob. 35TECh. 6 - Prob. 36TECh. 6 - Prob. 37TECh. 6 - Prob. 38TECh. 6 - Prob. 39TECh. 6 - Prob. 40TECh. 6 - In Exercises 3841, perform the long division. 41....Ch. 6 - Prob. 1RECh. 6 - Prob. 2RECh. 6 - Prob. 3RECh. 6 - Prob. 4RECh. 6 - Prob. 5RECh. 6 - Prob. 6RECh. 6 - Prob. 7RECh. 6 - Prob. 8RECh. 6 - Solve x4 x3 20x2 = 0.Ch. 6 - Prob. 10RECh. 6 - Prob. 11RECh. 6 - Prob. 12RECh. 6 - Prob. 13RECh. 6 - Prob. 14RECh. 6 - Prob. 15RECh. 6 - Prob. 16RECh. 6 - Prob. 17RECh. 6 - Prob. 18RECh. 6 - Find one solution of 3x3 x2 12x + 4 = 0...Ch. 6 - Find one solution of 2x3 + 5x2 4x 3 = 0...Ch. 6 - Prob. 21RECh. 6 - Prob. 22RECh. 6 - Prob. 23RECh. 6 - Prob. 24RECh. 6 - Prob. 25RECh. 6 - Prob. 26RECh. 6 - Prob. 27RECh. 6 - Prob. 28RECh. 6 - Prob. 29RECh. 6 - Prob. 30RECh. 6 - Prob. 31RECh. 6 - Prob. 32RECh. 6 - Prob. 33RECh. 6 - Revenue The monthly revenue for a product is given...Ch. 6 - Prob. 35RECh. 6 - Prob. 36RECh. 6 - Prob. 37RECh. 6 - Prob. 38RECh. 6 - Foreign Born Population The table on the following...Ch. 6 - Prob. 40RECh. 6 - Prob. 41RECh. 6 - Break-Even The daily profit in dollars for a...Ch. 6 - Starbucks The table gives the total number of...Ch. 6 - Drugs in the Bloodstream The concentration of a...Ch. 6 - Prob. 45RECh. 6 - Prob. 46RECh. 6 - Prob. 47RECh. 6 - Prob. 48RECh. 6 - Prob. 49RECh. 6 - Prob. 50RECh. 6 - Prob. 51RECh. 6 - Prob. 52RECh. 6 - Prob. 53RECh. 6 - Cost-Benefit The percent p of particulate...
Knowledge Booster


Learn more about
Need a deep-dive on the concept behind this application? Look no further. Learn more about this topic, subject and related others by exploring similar questions and additional content below.Similar questions
- Mortgage Rates The following table is taken from the website of Freddie Mac. It shows rates for 30-year fixed-rate mortgages since 1970. y=Year r=Mortgagerate 1975 9.05 1980 13.74 1985 12.43 1990 10.13 1995 7.93 2000 8.05 2005 5.87 2010 4.69 2015 3.84 a. Explain in practical terms the meaning of r(2003). b. Use the table to estimate the value of r(2003).arrow_forwardFarms in the United States The graph gives the number of farms in the United States from 1850 to 2000. aEstimate the average rate of change in the number of farms between i 1860 and 1890 and ii 1950 and 1970. bIn which decade did the number of farms experience the greatest average rate of decline?arrow_forwardThe distance (in kilometers) and price (in dollars) for one-way airline tickets from San Francisco to several cities are shown in the accompanying table. Complete parts a through d below. E Click the icon to view the data on airline ticket prices. a. Find the corelation coefficient for these data using a computer or statistical calculator. Use distance as the x-variable and price as the y-variable. (Round to three decimal places as needed.) r= b. Recalculate the correlation coefficient for these data using price as the x-variable and distance as the y-variable. What effect does this have on the correlation coefficient? Select the correct choice below and fill in the answer box to complete your choice. (Round to three decimal places as needed.) Airline Ticket Prices A. The correlation coefficient is r= The correlation coefficient decreases when the order of the variables is changed. B. The correlation coefficient is r= The correlation coefficient remains the same when the order of the…arrow_forward
- Answer the circled onesarrow_forwardLook at the data in the image. ONLY answer question 1.arrow_forwardEstimate the rate ratio for postmenopausal vs. premenopausal women after controlling for age. (Round your answer to two decimal places.) Provide a 95% CI for the rate ratio. (Enter your answer using interval notation. Round your numerical values to two decimal places.)arrow_forward
- Use the scatter plot to answer the following questions: 1. What type of association does the scatter plot have? (Positive, negative or no association) 2. As the monthly income (increases or decreases), the percent of the income save (increases or decreases) 3. Which person makes the most money per month? ( Nancy or mike.) How much do they make? (1,800 or 2,400)arrow_forwardThe amount of time adults spend watching television is closely monitored by firms because this helps to determine advertising pricing for commercials. Complete parts (a) through (d). C (a) Do you think the variable "weekly time spent watching television" would be normally distributed? If not, what shape would you expect the variable to have? A. The variable "weekly time spent watching television" is likely skewed right, not normally distributed. O B. The variable "weekly time spent watching television" is likely symmetric, but not normally distributed. OC. The variable "weekly time spent watching television" is likely skewed left, not normally distributed. O D. The variable "weekly time spent watching television" is likely normally distributed. O E. The variable "weekly time spent watching television" is likely uniform, not normally distributed. (b) According to a certain survey, adults spend 2.45 hours per day watching television on a weekday. Assume that the standard deviation for…arrow_forwardThe amount of time adults spend watching television is closely monitored by firms because this helps to determine advertising pricing for commercials. Complete parts (a) through (d). C (a) Do you think the variable "weekly time spent watching television" would be normally distributed? If not, what shape would you expect the variable to have? A. The variable "weekly time spent watching television" is likely skewed right, not normally distributed. O B. The variable "weekly time spent watching television" is likely symmetric, but not normally distributed. O C. The variable "weekly time spent watching television" is likely skewed left, not normally distributed. O D. The variable "weekly time spent watching television" is likely normally distributed. O E. The variable "weekly time spent watching television" is likely uniform, not normally distributed. (b) According to a certain survey, adults spend 2.45 hours per day watching television on a weekday. Assume that the standard deviation for…arrow_forward
- The amount of time adults spend watching television is closely monitored by firms because this helps to determine advertising pricing for commercials. Complete parts (a) through (d). C (a) Do you think the variable "weekly time spent watching television" would be normally distributed? If not, what shape would you expect the variable to have? A. The variable "weekly time spent watching television" is likely skewed right, not normally distributed. OB. The variable "weekly time spent watching television" is likely symmetric, but not normally distributed. O C. The variable "weekly time spent watching television" is likely skewed left, not normally distributed. O D. The variable "weekly time spent watching television" is likely normally distributed. O E. The variable "weekly time spent watching television" likely uniform, not normally distributed. (b) According to a certain survey, adults spend 2.45 hours per day watching television on a weekday. Assume that the standard deviation for "time…arrow_forwardThe data in the accompanying table represent the length of life, in years, measured to the nearest tenth, of 30 similar fuel pumps. Complete parts (a) through (c) below. Click the icon to view the fuel pump data. (a) Construct a stem-and-leaf plot for the life in years of the fuel pumps, using the digit to the left of the decimal point as the stem for each observation. Stem Leaf Frequency Get more help. Fuel Pump Life Spans 2.4 3.3 0.4 3.1 1.3 0.2 0.5 5.6 5.9 6.2 0.5 2.4 1.4 4.3 6.3 1.7 4.9 0.2 4.6 0.4 1.5 0.5 2.3 4.8 1.0 5.6 5.9 6.0 1.2 0.2 Print Done -X eck answarrow_forwardThe students in a class collected data on the number of minutes some of them spend brushing their teeth every day. That data is shown in the dot plot below. BRUSHING TEETHBRUSHING TEETH 0.511.522.533.544.5 Time Brushing (minutes) What was the shortest time someone spent brushing their teeth? minutesarrow_forward
arrow_back_ios
SEE MORE QUESTIONS
arrow_forward_ios
Recommended textbooks for you
 College AlgebraAlgebraISBN:9781305115545Author:James Stewart, Lothar Redlin, Saleem WatsonPublisher:Cengage Learning
 Algebra and Trigonometry (MindTap Course List)AlgebraISBN:9781305071742Author:James Stewart, Lothar Redlin, Saleem WatsonPublisher:Cengage Learning
 Functions and Change: A Modeling Approach to Coll...AlgebraISBN:9781337111348Author:Bruce Crauder, Benny Evans, Alan NoellPublisher:Cengage Learning
 Glencoe Algebra 1, Student Edition, 9780079039897...AlgebraISBN:9780079039897Author:CarterPublisher:McGraw Hill
 College Algebra (MindTap Course List)AlgebraISBN:9781305652231Author:R. David Gustafson, Jeff HughesPublisher:Cengage Learning
 Algebra & Trigonometry with Analytic GeometryAlgebraISBN:9781133382119Author:SwokowskiPublisher:Cengage
College Algebra
Algebra
ISBN:9781305115545
Author:James Stewart, Lothar Redlin, Saleem Watson
Publisher:Cengage Learning
Algebra and Trigonometry (MindTap Course List)
Algebra
ISBN:9781305071742
Author:James Stewart, Lothar Redlin, Saleem Watson
Publisher:Cengage Learning
Functions and Change: A Modeling Approach to Coll...
Algebra
ISBN:9781337111348
Author:Bruce Crauder, Benny Evans, Alan Noell
Publisher:Cengage Learning
Glencoe Algebra 1, Student Edition, 9780079039897...
Algebra
ISBN:9780079039897
Author:Carter
Publisher:McGraw Hill
College Algebra (MindTap Course List)
Algebra
ISBN:9781305652231
Author:R. David Gustafson, Jeff Hughes
Publisher:Cengage Learning
Algebra & Trigonometry with Analytic Geometry
Algebra
ISBN:9781133382119
Author:Swokowski
Publisher:Cengage
Time Series Analysis Theory & Uni-variate Forecasting Techniques; Author: Analytics University;https://www.youtube.com/watch?v=_X5q9FYLGxM;License: Standard YouTube License, CC-BY
Operations management 101: Time-series, forecasting introduction; Author: Brandoz Foltz;https://www.youtube.com/watch?v=EaqZP36ool8;License: Standard YouTube License, CC-BY