
Concept explainers
Videos
Finger Length of Criminals. In 1902, W. R. Macdonell published the article “On Criminal Anthropometry and the Identification of Criminals” (Biometrika, Vol. 1, pp. 177–227). Among other things, the author presented data on the left middle finger length, in centimeters. The following table provides the midpoints and frequencies of the finger-length classes used.
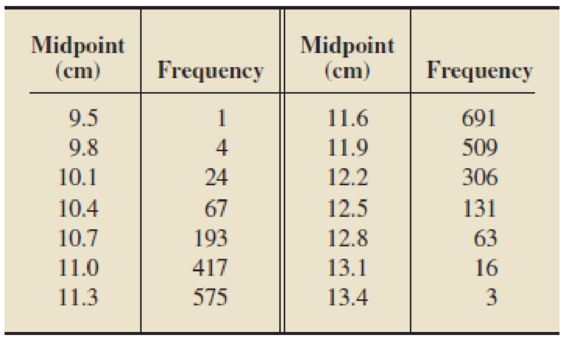
Use these data and the technology of your choice to assess the normality of middle finger length of criminals by using
- a. a histogram.
- b. a normal
probability plot.
Want to see the full answer?
Check out a sample textbook solution
Chapter 6 Solutions
Introductory Statistics, Books a la Carte Plus NEW MyLab Statistics with Pearson eText -- Access Card Package (10th Edition)
Additional Math Textbook Solutions
Basic Business Statistics, Student Value Edition
Introductory Statistics (2nd Edition)
Statistics for Psychology
Introductory Statistics
PRACTICE OF STATISTICS F/AP EXAM
Statistics: Informed Decisions Using Data (5th Edition)


- The geoemetric mean of 2, 4 & 8.arrow_forwardA study was done of 6 patients admitted to a hospital. Their ages (x) and systolic blood pressure (y) was recorded. Systolic blood pressure (y) Age (x) 43 123 48 125 56 135 61 143 67 145 70 152arrow_forwardFrom the data given below, calculate Karl Pearson's and Bowley's coefficients of skewness. Mean = 150, Median = 142, Q, = 62, Q3 = 195, D, = 30, D, = 230, S.D. = 30arrow_forward
- 3.2) Tabulation & Display of Quantitative Data1. Tabulation – Constr. a frequency Distr. TableQuestion 1 : Use the data provided in Q.3 of Section 3 to constr. a freq. distr. Table1. The following data are marks of students in an examination.24 61 36 81 45 37 78 65 60 3947 51 35 82 63 60 58 37 52 2490 87 18 8 29 46 35 64 27 50a. Construct a frequency distribution for the data.b. Compile the cumulative frequency table and draw the cumulative frequency curve.c. If the minimum for grade A was fixed at 74, estimate from your curve the percentage of candidates obtaining grade A.HINTS : Step 1 : Determine the Range, R = HDV – LDVStep 2 : Determine the number of Classes, KK = 1 + 3.3 log NStep 3 : Determine the Width, W for the classesarrow_forwarda. Which data set has a larger variation? (justify your answer)b. Is Chebyshev' rule verified for these two data sets. (Justify your answer graphically).c. What can we conclude?arrow_forward8. Formulating directional and nondirectional hypotheses The body mass index (BMI) of a person is the person’s weight divided by the square of his or her height. It is an indirect measure of the person’s body fat and an indicator of obesity. Results from surveys conducted by the Centers for Disease Control and Prevention (CDC) showed that the estimated mean BMI for US adults increased from 25.0 in the 1960–1962 period to 28.1 in the 1999–2002 period. [Source: Ogden, C., et al. (2004). Mean body weight, height, and body mass index, United States 1960–2002. Advance Data from Vital and Health Statistics, No. 347.] Suppose you are a health researcher. You conduct a hypothesis test to determine whether the mean BMI of US adults in the current year is lower than the mean BMI of US adults in 2000. Assume that the mean BMI of US adults in 2000 was 28.1 (the population mean). You obtain a sample of BMI measurements of 1,034 US adults, which yields a sample mean of M = 28.9. Let μ denote…arrow_forward
- A sample of blood pressure measurements is taken from a data set and those values (mm Hg) are listed below. The values are matched so that subjects each have systolic and diastolic measurements. Find the mean and median for each of the two samples and then compare the two sets of results. Are the measures of center the best statistics to use with these data? What else might be better? Systolic: 122 137 158 114 156 143 99 112 115 152 Diastolic: 61 51 76 73 55 58 74 60 87 59 Find the means. The mean for systolic is mm Hg and the mean for diastolic is mm Hg. (Type integers or decimals rounded to one decimal place as needed.) ***arrow_forwardSleep apnea is a disorder in which you have one or more pauses in breathing or shallow breaths while you sleep. In a cross-sectional study of 390 adults who suffer from sleep apnea, it was found that 273 had gum disease. Note: In the general population, about 17.5% of individuals have gum disease. Complete parts (a) through (c) below. Click here to view the standard normal distribution table (page 1). Click here to view the standard normal distribution table (page 2). Click here to view the table of critical t-values. 4 (a) What does it mean for this study to be cross-sectional?arrow_forwarda. Compute the incidence rate of coronary artery disease in patients receiving the new cholesterol medication. b. Compute the incidence rate of coronary artery disease in patients receiving a placebo. attached is the image of the data for this problemarrow_forward
- Please also determine a box plot for the men’s data. Question 4arrow_forwardb) The amount of money earned in a day by Ms. Anne’s craft shop was recorded and displayed in the stem-and-leaf diagram shown below in Exhibit 1. Exhibit 1 Stem-and-leaf of Data: Amount of Money earned in a day in dollars Leaf Unit = 10 N = * 2 2 59 5 3 234 13 3 55779999 (**) 4 0001233 14 4 5569 *** 5 03344 5 5 7788 1 6 1 Use the stem-and-leaf diagram above to draw a box-and-whisker diagram.arrow_forwardA sample of blood pressure measurements is taken from a data set and those values (mm Hg) are listed below. The values are matched so that subjects each have systolic and diastolic measurements. Find the mean and median for each of the two samples and then compare the two sets of results. Are the measures of center the best statistics to use with these data? What else might be better? Systolic: 97 96 134 112 154 116 156 99 153 117 Diastolic: 63 55 87 73 76 88 85 79 69 62 Find the means. The mean for systolic is nothing mm Hg and the mean for diastolic is nothing mm Hg. (Type integers or decimals rounded to one decimal place as needed.) Find the medians. The median for systolic is nothing mm Hg and the median for diastolic is nothing mm Hg. (Type integers or decimals rounded to one decimal place as needed.) Compare the results. Choose the correct answer below. A. The median is lower for the…arrow_forward
 MATLAB: An Introduction with ApplicationsStatisticsISBN:9781119256830Author:Amos GilatPublisher:John Wiley & Sons Inc
 Probability and Statistics for Engineering and th...StatisticsISBN:9781305251809Author:Jay L. DevorePublisher:Cengage Learning
 Statistics for The Behavioral Sciences (MindTap C...StatisticsISBN:9781305504912Author:Frederick J Gravetter, Larry B. WallnauPublisher:Cengage Learning
 Elementary Statistics: Picturing the World (7th E...StatisticsISBN:9780134683416Author:Ron Larson, Betsy FarberPublisher:PEARSON
 The Basic Practice of StatisticsStatisticsISBN:9781319042578Author:David S. Moore, William I. Notz, Michael A. FlignerPublisher:W. H. Freeman
 Introduction to the Practice of StatisticsStatisticsISBN:9781319013387Author:David S. Moore, George P. McCabe, Bruce A. CraigPublisher:W. H. Freeman