
Concept explainers
Videos
To determine a graph showing how they can split the driving each day.
Explanation of Solution
Given:
One friend drives at an average speed of 60 miles/hour
Other friend drives at an average speed of 55 miles/hour
Drive at least 500 miles per day
Plan to spend no more than 10 hours driving each day
Calculation:
Let’s consider
The minimum driving per day 500 miles.
So the equation is,
Plan to spend no more than 10 hours driving each day,
So equation representation is,
Slower driver drives few hours:
Graph:
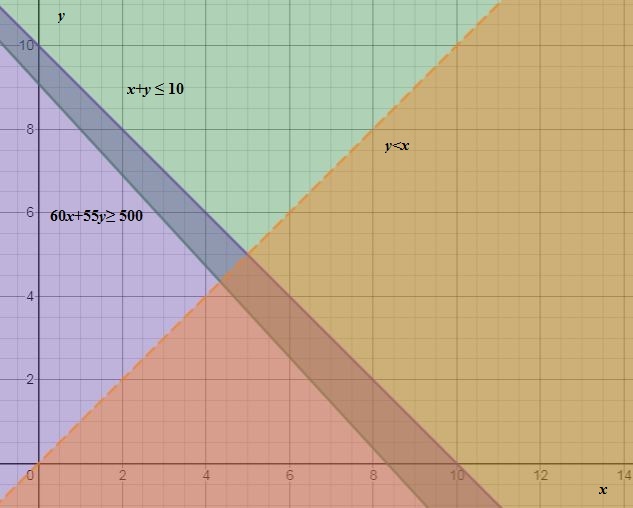
The purple line and below it represents
The green line and above it represents
The yellow line and below it represents
Interpretation:
Therefore, the graph showing how they can split the driving each day.
Chapter 6 Solutions
High School Math 2015 Common Core Algebra 1 Student Edition Grade 8/9
Additional Math Textbook Solutions
Elementary Algebra
College Algebra (10th Edition)
Intermediate Algebra (7th Edition)
College Algebra (6th Edition)
Elementary and Intermediate Algebra: Concepts and Applications (7th Edition)
College Algebra (5th Edition)


 Algebra and Trigonometry (6th Edition)AlgebraISBN:9780134463216Author:Robert F. BlitzerPublisher:PEARSON
 Contemporary Abstract AlgebraAlgebraISBN:9781305657960Author:Joseph GallianPublisher:Cengage Learning
 Linear Algebra: A Modern IntroductionAlgebraISBN:9781285463247Author:David PoolePublisher:Cengage Learning
 Algebra And Trigonometry (11th Edition)AlgebraISBN:9780135163078Author:Michael SullivanPublisher:PEARSON
 Introduction to Linear Algebra, Fifth EditionAlgebraISBN:9780980232776Author:Gilbert StrangPublisher:Wellesley-Cambridge Press
 College Algebra (Collegiate Math)AlgebraISBN:9780077836344Author:Julie Miller, Donna GerkenPublisher:McGraw-Hill Education