
Concept explainers
Videos
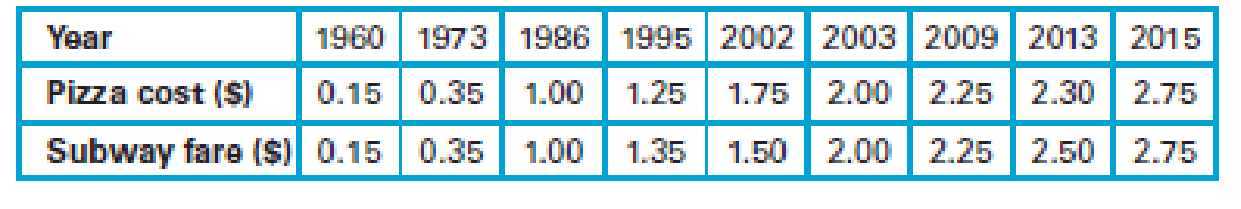
Pizza and the Subway. For Exercises 1–6, refer to the following table that lists the cost (in dollars) of a slice of pizza in New York City and the subway fare in the same year.
1. Construct a
Draw a scatter plot.
Explain the result from the scatter plot.
Answer to Problem 1CRE
- The scatter plot is given below:

Explanation of Solution
Calculation:
The costs of a slice of pizza and the subway fares in New York for a year are given.
Best-fit line:
In a scatter plot, the best possible straight line, which is closest to the points is called best-fit line.
Scatter plot with fitted line:
Software procedure:
Step-by-step software procedure to draw scatter plot using EXCEL software is as follows:
- Open an EXCEL file.
- In column A and B, the Pizza cost and Subway fare data were entered.
- Select the data > click on insert.
- Chose X Y (Scatter) from chart.
- Click OK.
- Click on the data points>right click> add trendline.
- Choose linear.
- Click on display equation on chart and display R-squared value on chart.
- Output using EXCEL software is given below:
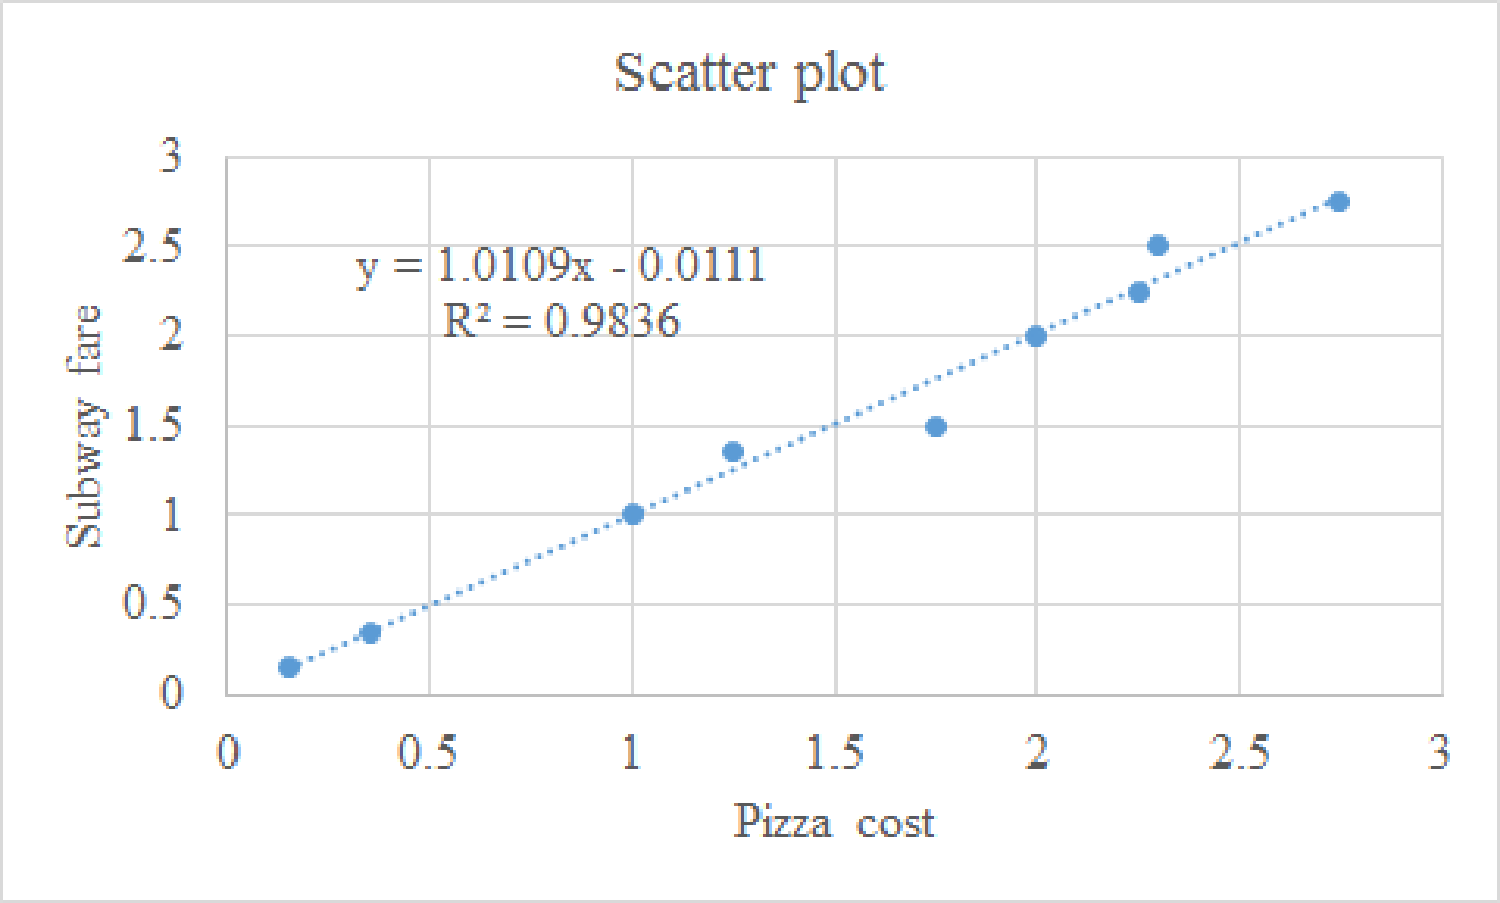
From the above scatter plot, it can be said that all the points are nearer to the best fitted line.
The coefficient of determination is 98.36%. Thus, 98.36% variability in subway fare can be explained by the pizza cost using the best fitted model.
Hence, it can be said that the fit is very good.
Moreover, it can be said that for increasing pizza cost, the subway fare has also increased and the trend line is an ascending trend line. Therefore, there is a strong positive correlation between the variables.
Want to see more full solutions like this?
Chapter 7 Solutions
Statistical Reasoning for Everyday Life Plus MyLab Statistics with Pearson eText -- 18 Week Access Card Package (5th Edition)


- O.R data preparation is a trivial step, due to the time required and the possibility of data collection errors. True of fallsarrow_forwardThe boxplot below shows salaries for Construction workers and Teachers. Construction Teacher 20 25 30 35 40 45 50 Salary (thousands of S) If a person is making the maximum salary for a construction worker, they are making more than what percentage of Teachers?arrow_forward3. I need help with this (Not honor class)arrow_forward
- Q4A The World Bank collected data on the percentage of GDP that a country spends on health expenditures ("Health expenditure," 2013) and also the percentage of women receiving prenatal care ("Pregnant woman receiving," 2013). The data for the 15 countries where this information are available for the year 2011 is in the table below: Health Expenditure (% of GDP) Prenatal Care (%) 9.6 47.9 3.7 54.6 5.2 93.7 5.2 84.7 10.0 100.0 4.7 42.5 4.8 96.4 6.0 77.1 5.4 58.3 4.8 95.4 4.1 78.0 6.0 93.3 9.5 93.3 6.8 93.7 6.1 89.8 1. Determine the correlation between variables (if it exists) in this relation. Which variable is the dependent (output) variable? A. Percent of women receiving prenatal care B. Percent of gross domestic product (GDP) spent on healthcare Enter letter corresponding to correct answer 2. Using technology, determine coefficient of correlation r Enter r value to…arrow_forwardQ2A The World Bank collected data on the percentage of GDP that a country spends on health expenditures ("Health expenditure," 2013) and also the percentage of women receiving prenatal care ("Pregnant woman receiving," 2013). The data for the 15 countries where this information are available for the year 2011 is in the table below: Health Expenditure (% of GDP) Prenatal Care (%) 9.6 47.9 3.7 54.6 5.2 93.7 5.2 84.7 10.0 100.0 4.7 42.5 4.8 96.4 6.0 77.1 5.4 58.3 4.8 95.4 4.1 78.0 6.0 93.3 9.5 93.3 6.8 93.7 6.1 89.8 2. Use technology to determine regression equation between percentage GDP spent on health and percentage of women receiving prenatal care. Enter regression equation the format as follows: y^=a+bx with slope rounded to nearest thousandth and y-intercept value rounded to nearest thousandth. Examples of correctly entered answers: y^=4.913+17.347x y^=7.553-11.225x Linear…arrow_forward15.) Complete the below table by determining the pattern. Then decide if the relationship is linear or exponential. Input Output 25 I 28 31 1. 2. 3. 4.arrow_forward
- Alarger household produces more garbage, on average, than a smaller household. If we know the amount of metal M and plastic P of waste product produced each week, we can estimate the household size H from H=aM+bP+c. The table to the right contains representative data for three households. Complete parts (a) and (b). H (people) 6 REEDE The size of the household is approximately people. (Round to the nearest whole number as needed.) 7 M (pounds) 5.00 2.50 7.00 (a) Model this data using H=aM+bP+c, where a, b, and care constants. H=M+P+ (Simplify your answers. Type integers or decimals.) (b)Predict the size of a household that produces 5 pounds of metal waste and 4 pounds of plastic waste each week P (pounds) 1.70 0.45 1.30arrow_forwardPlease answer question d)arrow_forward(Q.5) Mastery Assess It 2 - Question is in the photo privided below.arrow_forward
- Regression and Predictions. Exercises 13–28 use the same data sets as Exercises 13–28 in Section 10-1. In each case, find the regression equation, letting the first variable be the predictor (x) variable. Find the indicated predicted value by following the prediction procedure summarized in Figure 10-5 on page 493. Tips Using the bill/tip data, find the best predicted tip amount for a dinner bill of $100. What tipping rule does the regression equation suggest?arrow_forward???arrow_forwardI-Answer Completely 6. A = 1,240,000; r = 8% per year; t 30 years %3D %3D %3D 7. A=786,000; P = 247,000; t= 17 years %3D 8. A = 786; P = 247; t 7 years 9. A = 731,093; P = 255,600; r = 3% per year %3D 10. Supppose the population of a certain bacteria in a laboratory sample is 100. If it doubles in population every 6 hours, what is the growth rate? How many bacteria will be in two days?arrow_forward
 Glencoe Algebra 1, Student Edition, 9780079039897...AlgebraISBN:9780079039897Author:CarterPublisher:McGraw Hill