
Concept explainers
Videos
EXERCISES
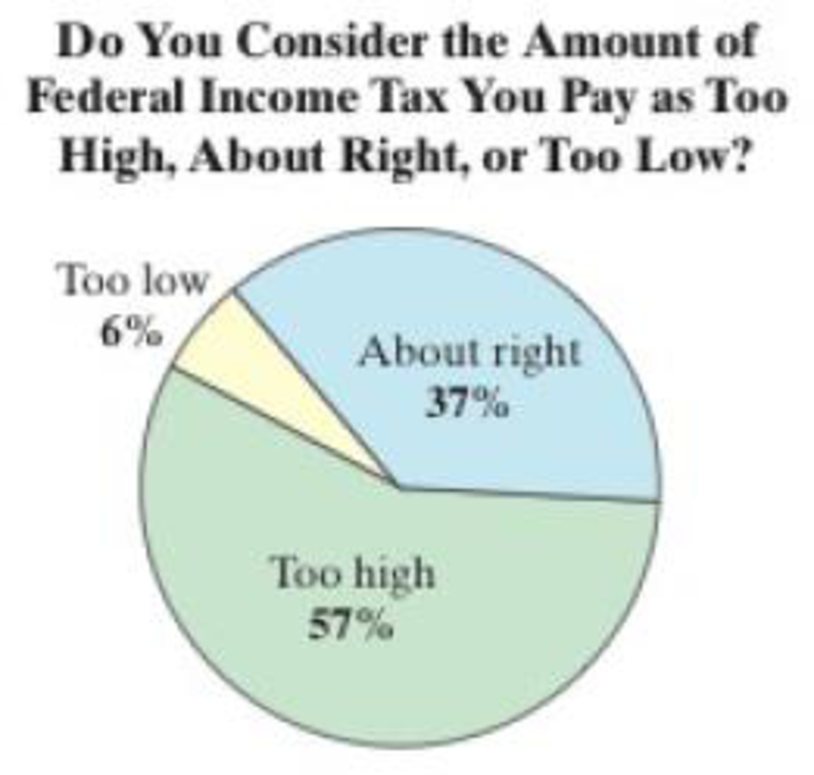
In Exercises 1–3, assume that you work for the Internal Revenue Service. You are asked to write a report about the claim that 57% of U.S. adults think the amount of federal income tax they pay is too high. (Source: Gallup)
- 1. What is the null hypothesis in this situation? Describe how your report could be incorrect by trying to prove the null hypothesis.
- 2. Describe how your report could make a type I error.
- 3. Describe how your report could make a type II error.
To state: The null hypothesis in the given situation and describe how the report could be incorrect by trying to prove the null hypothesis.
Answer to Problem 1UA
The null hypothesis in the given situation is,
When type error is present, the report could be incorrect by trying to prove the null hypothesis.
Explanation of Solution
Null hypothesis:
Null hypothesis is a statement about the population parameter. Its value is equal to the claim value, which is denoted by
Alternative hypothesis:
It is complementary to the null hypothesis. That is, it differs from the null hypothesis. The possible symbols used in the alternative hypothesis would be <,>, or ≠. It is denoted by
Here, the claim is that, “57% of U.S adults think the amount of federal income tax they pay is too high”. This can be written as
Null hypothesis:
Type I error: Rejecting the null hypothesis, when it is actually true.
Type II error: Failing to reject the null hypothesis, when it is false.
A type I error occurs when the hypothesis test indicates that the percentage of U.S. adults think the amount of federal income tax they pay is too high is not 57%; but in reality, the percentage of U.S. adults think the amount of federal income tax they pay is too high is 57%. Thus, the report could be incorrect by trying to prove the null hypothesis when the type error I is present.
Want to see more full solutions like this?
Chapter 7 Solutions
EP ELEMEN.STAT.-MYSTATLAB+ETEXT ACCESS


- What is an experiment? Give two examples.arrow_forwardWhat term is used to express the likelihood of an event occurring? Are there restrictions on its values? If so, what are they? If not, explain.arrow_forwardTraditionally in hypothesis testing, the null hypothesis represents the "status quo" which will be overturned only if there is evidence against it. Which of the statements below might represent a null hypothesis? 1. the treatment increase survival rates 2.the teaching method raises SAT score 3. the teaching method does not chang SAT scorearrow_forward
- Part a) When performing a hypothesis test, what effect does increasing the sample size have on the probability of type 1 error? Why? Part b) when performing a hypothesis test, what effect does increasing the sample size have on the power? Why?arrow_forwardI’m testing the claim that a population exceeds .62, the null hypothesis is H0, what is it?arrow_forwardPart D) what is the null hypothesis and what do we conclude?arrow_forward
- A Gallup Poll in November of 2008 showed that 22% of men (110 out of 500) said they were seriously trying to lose weight. In 2006, 24% of men (120 out of 500) said they were seriously trying to lose weight. a) Determine the proportions of men in 2006 and in 2008 were seriously trying to lose weight. Let p1 stand for 2008 data and p2 be for 2006 data. b) state the null and alternate hypothesis. c) Use your calculator to run a two-proportion hypothesis test. Interpret your result with respect to the significance level and the hypotheses in the context of the problem. (As part of your answer, write what you entered into your calculator for the hypothesis test.)arrow_forwardWhat would be your decision? A. There is insufficient data to make a decision. B. do not reject the null hypothesis. C. Reject the null hypothesis. D. Reject the alternative hypothesis.arrow_forwardIf you conduct a hypothesis test every so often at a 95% level, about what fraction of the time do you expect to reject the null hypothesis even though you should not? Explain using a sentence or two.arrow_forward
- At one school, the average amount of time that tenth-graders spend watching television each week is 15.5 hours. The principal introduces a campaign to encourage the students to watch less television. One year later, the principal wants to perform a hypothesis test to determine whether the average amount of time spent watching television per week has changedarrow_forwardDetermine whether the claim stated below represents the null hypothesis or the alternative hypothesis. If a hypothesis test is performed, how should you interpret a decision that (a) rejects the null hypothesis or (b) fails to reject the null hypothesis? A report claims that less than 80% of households in a specific county struggle to afford basic necessities. Does the claim represent the null hypothesis or the alternative hypothesis?arrow_forward


 College Algebra (MindTap Course List)AlgebraISBN:9781305652231Author:R. David Gustafson, Jeff HughesPublisher:Cengage Learning