
Concept explainers
Videos
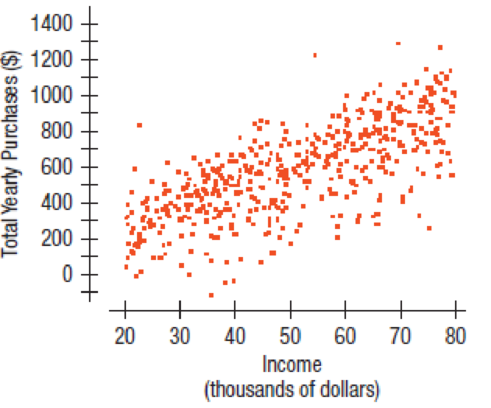
Online clothes II For the online clothing retailer discussed in the previous problem, the
The
| Mean | SD | |
| Income | $50,343.40 | $16,952.50 |
| Total Yearly Purchase | $572.52 | $253.62 |
a) What is the linear regression equation for predicting Total Yearly Purchase from Income?
b) Do the assumptions and conditions for regression appear to be met?
c) What is the predicted Total Yearly Purchase for someone with a yearly Income of $20,000? For someone with an annual Income of $80,000?
d) What percent of the variability in Total Yearly Purchases is accounted for by this model?
e) Do you think the regression might be a useful one for the company? Comment.
Want to see the full answer?
Check out a sample textbook solution
Chapter 7 Solutions
Intro STATS, Books a la Carte Plus New Mystatlab with Pearson Etext -- Access Card Package
Additional Math Textbook Solutions
Statistics for Engineers and Scientists
Business Analytics
Statistics Through Applications
Probability and Statistics for Engineering and the Sciences
Business Analytics
Stats: Modeling the World Nasta Edition Grades 9-12


 Functions and Change: A Modeling Approach to Coll...AlgebraISBN:9781337111348Author:Bruce Crauder, Benny Evans, Alan NoellPublisher:Cengage Learning
 Glencoe Algebra 1, Student Edition, 9780079039897...AlgebraISBN:9780079039897Author:CarterPublisher:McGraw Hill
 Big Ideas Math A Bridge To Success Algebra 1: Stu...AlgebraISBN:9781680331141Author:HOUGHTON MIFFLIN HARCOURTPublisher:Houghton Mifflin Harcourt