
Statistical Reasoning for Everyday Life (5th Edition)
5th Edition
ISBN: 9780134494043
Author: Jeff Bennett, William L. Briggs, Mario F. Triola
Publisher: PEARSON
expand_more
expand_more
format_list_bulleted
Concept explainers
Videos
Textbook Question
Chapter 7, Problem 6CRE
Pizza and the Subway. For Exercises 1–6, refer to the following table that lists the cost (in dollars) of a slice of pizza in New York City and the subway fare in the same year.
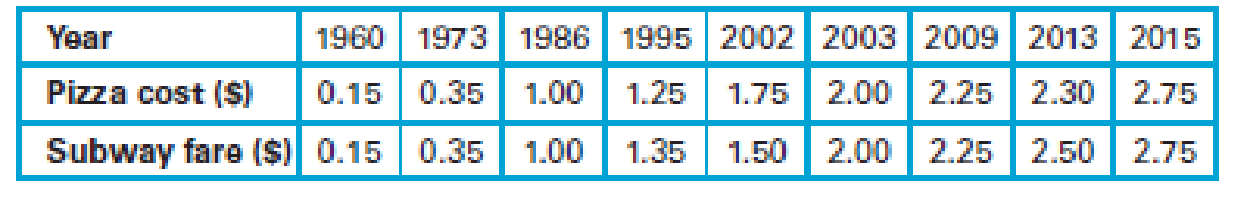
6. Using the equation for the best-fit line, we find that when a slice of pizza costs $1000, the predicted subway fare is $1011. Is that predicted subway fare likely to be an accurate prediction? Why or why not?
Expert Solution & Answer
Want to see the full answer?
Check out a sample textbook solution
Students have asked these similar questions
Use the data and develop a model to predict Overall Satisfaction.
If a customer reports satisfaction with trade price as 3.3 and satisfaction with the speed of execution as 2.6, we can predict their overall satisfaction to be what? (Keep one decimal place)
Brokerage
Satisfaction with Trade Price
Satisfaction with Speed of Execution
Overall Satisfaction with Electronic Trades
Scottrade, Inc.
3.4
3.4
3.5
Charles Schwab
3.2
3.3
3.4
Fidelity Brokerage Services
3.1
3.4
3.9
TD Ameritrade
2.9
3.6
3.7
E*Trade Financial
2.9
3.2
2.9
(Not listed)
2.1
3.2
2.7
Vanguard Brokerage Services
2.0
3.8
2.8
USAA Brokerage Services
2.1
3.8
3.6
Thinkorswim
1.9
2.6
2.6
Wells Fargo Investments
2.2
2.7
2.3
Interactive Brokers
3.1
4.0
4.0
Zecco.com
2.5
2.5
2.5
Firstrade Securities
3.0
3.0
4.0
Banc of America Investment Services
4.0
1.0
2.0
d) Prepare the scatter diagram and insert the trendline or line of best-fit. Use a scale of 2 cm to represent 1,000 units on the x-axis & 2 cm to represent $50,000 on the yaxis.e) Using the line of best-fit, determine the company’s fixed cost per month and the variable cost per unit. (Use 0 & 5,000 units.)f) Which of the two methods appear more appropriate? Explain your answer
Farmers know that driving heavy equipment on wet soil compresses the soil and injures future crops. Here are data on the "penetrability" of the same type of soil at two levels of compression. Penetrability is a measure of how much resistance plant roots will meet when they try to grow through the soil.
Compressed Soil:
2.85 3.082.6 2.822.95 2.782.82 2.982.76 3.002.81 2.782.78 2.963.08 2.902.94 3.182.86 3.16
Intermediate Soil:
3.13 3.543.32 3.363.1 3.183.40 3.123.38 3.863.14 2.923.18 3.463.26 3.442.96 3.623.02 4.26
Use the data, omitting the high outlier, to give a 96% confidence interval for the decrease in penetrability of compressed soil relative to intermediate soil. Compute degrees of freedom using the conservative method.Interval: To
Chapter 7 Solutions
Statistical Reasoning for Everyday Life (5th Edition)
Ch. 7.1 - Correlation. What is a correlation? Give three...Ch. 7.1 - Scatterplot. What is a scatterplot, and how is one...Ch. 7.1 - Types of Correlation. Define and distinguish...Ch. 7.1 - Correlation Coefficient. What does the correlation...Ch. 7.1 - Does It Make Sense? For Exercises 58, determine...Ch. 7.1 - Does It Make Sense? For Exercises 58, determine...Ch. 7.1 - Does It Make Sense? For Exercises 58, determine...Ch. 7.1 - Does It Make Sense? For Exercises 58, determine...Ch. 7.1 - Correlation. Exercises 916 list pairs of...Ch. 7.1 - Correlation. Exercises 916 list pairs of...
Ch. 7.1 - Correlation. Exercises 916 list pairs of...Ch. 7.1 - Correlation. Exercises 916 list pairs of...Ch. 7.1 - Correlation. Exercises 916 list pairs of...Ch. 7.1 - Correlation. Exercises 916 list pairs of...Ch. 7.1 - Correlation. Exercises 916 list pairs of...Ch. 7.1 - Correlation. Exercises 916 list pairs of...Ch. 7.1 - Crickets and Temperature. One classic example of a...Ch. 7.1 - Two-Day Forecast. Figure 7.8 shows a scatterplot...Ch. 7.1 - Properties of the Correlation Coefficient. For...Ch. 7.1 - Properties of the Correlation Coefficient. For...Ch. 7.1 - Properties of the Correlation Coefficient. For...Ch. 7.1 - Properties of the Correlation Coefficient. For...Ch. 7.1 - Scatterplot and Correlation. In Exercises 2330,...Ch. 7.1 - Scatterplot and Correlation. In Exercises 2330,...Ch. 7.1 - Scatterplot and Correlation. In Exercises 2330,...Ch. 7.1 - Prob. 26ECh. 7.1 - Scatterplot and Correlation. In Exercises 2330,...Ch. 7.1 - Scatterplot and Correlation. In Exercises 2330,...Ch. 7.1 - Scatterplot and Correlation. In Exercises 2330,...Ch. 7.1 - Scatterplot and Correlation. In Exercises 2330,...Ch. 7.1 - Your Own Positive Correlations. Give examples of...Ch. 7.1 - Your Own Negative Correlations. Give examples of...Ch. 7.2 - Outliers. Briefly explain how an outlier can make...Ch. 7.2 - Grouped Data. Briefly explain how data that...Ch. 7.2 - Explanations for Correlation. What are the three...Ch. 7.2 - Prob. 4ECh. 7.2 - Does It Make Sense? For Exercises 58, determine...Ch. 7.2 - Does It Make Sense? For Exercises 58, determine...Ch. 7.2 - Does It Make Sense? For Exercises 58, determine...Ch. 7.2 - Does It Make Sense? For Exercises 58, determine...Ch. 7.2 - Correlation and Causality. Exercises 916 present...Ch. 7.2 - Correlation and Causality. Exercises 916 present...Ch. 7.2 - Correlation and Causality. Exercises 916 present...Ch. 7.2 - Correlation and Causality. Exercises 916 present...Ch. 7.2 - Correlation and Causality. Exercises 916 present...Ch. 7.2 - Correlation and Causality. Exercises 916 present...Ch. 7.2 - Correlation and Causality. Exercises 916 present...Ch. 7.2 - Correlation and Causality. Exercises 916 present...Ch. 7.2 - Outlier Effects. Consider the scatterplot in...Ch. 7.2 - Outlier Effects. Consider the scatterplot in...Ch. 7.2 - Footprint and Height. The following table lists...Ch. 7.2 - January and July High Temperatures. The following...Ch. 7.2 - Birth and Death Rates. Figure 7.17 shows the birth...Ch. 7.2 - Penny Weight and Date. The scatterplot in Figure...Ch. 7.3 - Best-Fit Line. What is a best-fit line? How is a...Ch. 7.3 - Prob. 2ECh. 7.3 - Interpreting r2. What does the square of the...Ch. 7.3 - Prob. 4ECh. 7.3 - Prob. 5ECh. 7.3 - Does It Make Sense? For Exercises 58, determine...Ch. 7.3 - Does It Make Sense? For Exercises 58, determine...Ch. 7.3 - Does It Make Sense? For Exercises 58, determine...Ch. 7.3 - Best-Fit Lines. Exercises 916 refer to tables in...Ch. 7.3 - Best-Fit Lines. Exercises 916 refer to tables in...Ch. 7.3 - Prob. 11ECh. 7.3 - Best-Fit Lines. Exercises 916 refer to tables in...Ch. 7.3 - Best-Fit Lines. Exercises 916 refer to tables in...Ch. 7.3 - Best-Fit Lines. Exercises 916 refer to tables in...Ch. 7.3 - Prob. 15ECh. 7.3 - Prob. 16ECh. 7.4 - Correlation and Causality. What is the difference...Ch. 7.4 - Prob. 2ECh. 7.4 - Establishing Causality. Briefly state in your own...Ch. 7.4 - Confidence in Causality. Describe three levels of...Ch. 7.4 - Prob. 5ECh. 7.4 - Does It Make Sense? For Exercises 58, determine...Ch. 7.4 - Does It Make Sense? For Exercises 58, determine...Ch. 7.4 - Does It Make Sense? For Exercises 58, determine...Ch. 7.4 - Physical Models. For Exercises 912, determine...Ch. 7.4 - Physical Models. For Exercises 912, determine...Ch. 7.4 - Physical Models. For Exercises 912, determine...Ch. 7.4 - Physical Models. For Exercises 912, determine...Ch. 7.4 - Altitude and Health. When some people climb to...Ch. 7.4 - Smoking and Lung Cancer. There is a strong...Ch. 7.4 - Other Lung Cancer Causes. Several things besides...Ch. 7.4 - Longevity of Orchestra Conductors. A famous study...Ch. 7.4 - Older Moms. A study reported in Nature claims that...Ch. 7.4 - High-Voltage Power Lines. Suppose that people...Ch. 7.4 - Gun Control. Those who favor gun control often...Ch. 7.4 - Vasectomies and Prostate Cancer. The article Does...Ch. 7 - Pizza and the Subway. For Exercises 16, refer to...Ch. 7 - Pizza and the Subway. For Exercises 16, refer to...Ch. 7 - Pizza and the Subway. For Exercises 16, refer to...Ch. 7 - Pizza and the Subway. For Exercises 16, refer to...Ch. 7 - Pizza and the Subway. For Exercises 16, refer to...Ch. 7 - Pizza and the Subway. For Exercises 16, refer to...Ch. 7 - For 10 pairs of sample data values, the...Ch. 7 - In a study involving randomly selected subjects,...Ch. 7 - A researcher collects paired sample data values...Ch. 7 - Estimate the value of the linear correlation...Ch. 7 - Fill in the blanks: Every possible correlation...Ch. 7 - Which of the following are likely to have a...Ch. 7 - For a collection of 50 pairs of sample data...Ch. 7 - Estimate the correlation coefficient for the data...Ch. 7 - Refer again to the scatterplot in Figure 7.24....Ch. 7 - Fill in the blank: If r = 0.900, then _____ % of...Ch. 7 - In Exercises 710, determine whether the given...Ch. 7 - Prob. 8CQCh. 7 - Prob. 9CQCh. 7 - Prob. 10CQ
Knowledge Booster


Learn more about
Need a deep-dive on the concept behind this application? Look no further. Learn more about this topic, statistics and related others by exploring similar questions and additional content below.Similar questions
- Use this data for the exercises that follow: In 2013, there were roughly 317 million citizens in the United States, and about 40 million were elderly (aged 65 and over).[34] 60. It is predicted that by 2030, one in five U.S. citizens will be elderly. How much greater will the chances of meeting an elderly person be at that time? What policy changes do you foresee if these statistics hold true?arrow_forwardThe table shows the number of accidents, fatalities, hours and miles flew for U.S. airlines. Year Accidents Fatalities Hours flown Miles flown 2000 59 98 16.7 million 7.1 billions 2005 36 28 18.7 7.8 2010 29 0 17.2 7.3 2015 25 0 17.4 7.6 a. Compute the accident rate per million hours flown in 2000 and 2015. By this measure, has travel on U.S. airlines become safer? b. Compute the accident rate per billion miles flown in 2000 and 2015. By this measure, has travel on U.S. airlines become safer?arrow_forwardCellulon, a manufacturer of home insulation, wants to develop guidelines for builders and consumers on how the thickness of the insulation in the attic of a home and the outdoor temperature affect natural gas consumption. In the laboratory, it varied the insulation thickness and temperature. A few of the findings are: Monthly Natural Gas Consumption (cubic feet), Y Thickness of Insulation (inches), X1 Outdoor Temperature (°F), X2 30.3 6 40 26.9 12 40 22.1 8 49 How much natural gas can homeowners expect to use per month if they install 6 inches of insulation and the outdoor temperature is 40 degrees F? Group of answer choices 36.69 cubic feet 30.30 cubic feet 30.89 cubic feet 33.69 cubic feetarrow_forward
- A sample of students attending a large university has been selected. Is there a statistically significant difference between Liberal Arts majors and other students on average number of books (other than those required by course work) read per year? Use the five step model and write a sentence or two interpreting your results. liberal arts X1 = 16.2 s1 = 2.3 N1= 236 Other: x2 = 13.7 s2 =9.0 N2 = 321arrow_forwarda) If the prevalence rate is 50%, the sensitivity is 85%, and the specificity is 90%, what will the PPV value be? b) What are possible slider values that will produce a PPV value of 1? c) What are possible slider valuse that will produce an NPV value of 1? d) If sensitivity and specificity remain constant while prevalence decreases, what effect does that have on the PPV? e) If prevalence and specificity remain constant while sensitivity increases, what effect does that have on the NPV?arrow_forwardQ4. The stock prices of two companies are given below. Find their Coefficient of variation suggest the best company for investment with justification. Company A(OMR) 40 38 42 40 39 39 43 40 39 40 Company B(OMR) 46 37 40 33 42 36 40 47 34 45arrow_forward
- A district manager rewards sales teams based on overall sales generated in a month. The data for earnings are shown in the table. where Low represents the lowest sales and High represents the highest sales generated by a single sale team memberPart A: If the managerwants to award the sales team that has the most consistent earnings among its team members, Which team should it choose and why? Justify your answer mathematically. Part B: If the manager wants to award the sales team with the highest average earnings, which team should it choose and why? Justify your answer mathematically.arrow_forwardThe Minister of National Security in Trinidad and Tobago is interested in determining the factors that influence the number of crimes that are reported. You are tasked to develop a model using the appropriate variables. The following variables are utilized: X1 = total overall reported crime rate per 100,000 residents X2 = reported violent crime rate per 100,000 residents X3 = % of people 25 years+ with 4 yrs. of high school X4 = % of 16 to 19-year-olds not in high school and not high school graduates. X5 = % of 18 to 24-year-olds in college X6 = % of people 25 years+ with at least 4 years of college X1 X2 X3 X4 X5 X6 478 184 74 11 31 20 494 213 72 11 43 18 643 347 70 18 16 16 341 565 71 11 25 19 773 327 72 9 29 24 603 260 68 8 32 15 484 325 68 12 24 14 546 102 62 13 28 11 424 38 69 7 25 12 548 226 66 9 58 15 506 137…arrow_forwardThe Minister of National Security in Trinidad and Tobago is interested in determining the factors that influence the number of crimes that are reported. You are tasked to develop a model using the appropriate variables. The following variables are utilized: X1 = total overall reported crime rate per 100,000 residents X2 = reported violent crime rate per 100,000 residents X3 = % of people 25 years+ with 4 yrs. of high school X4 = % of 16 to 19-year-olds not in high school and not high school graduates. X5 = % of 18 to 24-year-olds in college X6 = % of people 25 years+ with at least 4 years of college X1 X2 X3 X4 X5 X6 478 184 74 11 31 20 494 213 72 11 43 18 643 347 70 18 16 16 341 565 71 11 25 19 773 327 72 9 29 24 603 260 68 8 32 15 484 325 68 12 24 14 546 102 62 13 28 11 424 38 69 7 25 12 548 226 66 9 58 15 506 137 60 13…arrow_forward
- When 20 employees were first hired in 2011 for a creative engineering firm, Company A, the starting annual salary was $35,000. A competing creative engineering firm, Company B, had the same starting salary for 20 employees hired the same year. In 2016, data was collected on the annual salaries of the same employees at each of the two companyies. This data is displayed in the box plot shown. Part A: what are the pros and cons of working at each company? Explain using what you found in Part Aarrow_forwardUse the data and develop a model to predict Overall Satisfaction. R2 is over 0.70 so we can use this model. Group of answer choices True False Brokerage Satisfaction with Trade Price Satisfaction with Speed of Execution Overall Satisfaction with Electronic Trades Scottrade, Inc. 3.4 3.4 3.5 Charles Schwab 3.2 3.3 3.4 Fidelity Brokerage Services 3.1 3.4 3.9 TD Ameritrade 2.9 3.6 3.7 E*Trade Financial 2.9 3.2 2.9 (Not listed) 2.1 3.2 2.7 Vanguard Brokerage Services 2.0 3.8 2.8 USAA Brokerage Services 2.1 3.8 3.6 Thinkorswim 1.9 2.6 2.6 Wells Fargo Investments 2.2 2.7 2.3 Interactive Brokers 3.1 4.0 4.0 Zecco.com 2.5 2.5 2.5 Firstrade Securities 3.0 3.0 4.0 Banc of America Investment Services 4.0 1.0 2.0arrow_forwardA fisherman has collected data about the length in inches, L, and weight in ounces, w, of fish he has caught. The resulting line of best fit for the data is w=−37.1+3.2L. Would predicting the weight of a 26-inch fish be interpolation or extrapolation? Explain. L 13 14 15 16 18 21 23 23 w 3 10 10 15 20 35 38 45 Using the model to predict the weight of a 26-inch fish is extrapolation because 26 inches is outside the range of the lengths in the data. Using the model to predict the weight of a 26-inch fish is interpolation because 26 inches is inside the range of the lengths in the data. Using the model to predict the weight of a 26-inch fish is extrapolation because 26 inches is inside the range of the lengths in the data. Using the model to predict the weight of a 26-inch fish is interpolation because 26 inches is outside the range of the lengths in the data.arrow_forward
arrow_back_ios
SEE MORE QUESTIONS
arrow_forward_ios
Recommended textbooks for you

 Glencoe Algebra 1, Student Edition, 9780079039897...AlgebraISBN:9780079039897Author:CarterPublisher:McGraw Hill
Glencoe Algebra 1, Student Edition, 9780079039897...
Algebra
ISBN:9780079039897
Author:Carter
Publisher:McGraw Hill
Use of ALGEBRA in REAL LIFE; Author: Fast and Easy Maths !;https://www.youtube.com/watch?v=9_PbWFpvkDc;License: Standard YouTube License, CC-BY
Compound Interest Formula Explained, Investment, Monthly & Continuously, Word Problems, Algebra; Author: The Organic Chemistry Tutor;https://www.youtube.com/watch?v=P182Abv3fOk;License: Standard YouTube License, CC-BY
Applications of Algebra (Digit, Age, Work, Clock, Mixture and Rate Problems); Author: EngineerProf PH;https://www.youtube.com/watch?v=Y8aJ_wYCS2g;License: Standard YouTube License, CC-BY