
Concept explainers
Videos
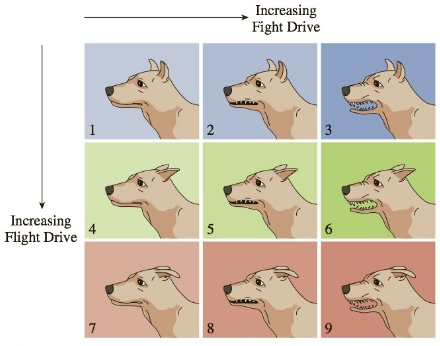
Animal Psychology Exercises 63–68 concern the following chart, which shows the way in which a dog moves its facial muscles when torn between the drives of fight and flight.7 The “fight” drive increases from left to right; the “flight” drive increases from top to bottom. (Notice that an increase in the “fight” drive causes the dog’s upper lip to lift, while an increase in the “flight” drive draws its ears downward.)
Describe the following events explicitly (as subsets of the sample space):
a. The dog’s fight and flight drives are both strongest.
b. The dog’s fight drive is strongest, but its flight drive is neither weakest nor strongest.
Want to see the full answer?
Check out a sample textbook solution
Chapter 7 Solutions
Bundle: Finite Mathematics, Loose-leaf Version, 7th + WebAssign Printed Access Card for Waner/Costenoble's Finite Mathematics, 7th Edition, Single-Term


- International Visitors The number of internationalvisitors to the United States for selected years 1986–2010 is given in the table below. If you had to pick one of these models to predictthe number of international visitors in the year2020, which model would be the more reasonablechoice?arrow_forwardAn observational study is conducted to compare experiences of men and women between the ages of 50‒59 years, following coronary artery bypass surgery. Participants undergo the surgery and are followed until the time of death, until they are lost to follow-up, or up to 30 years, whichever comes first. The following table details the experiences of participating men and women. The data below are years of death or years of last contact for men and women. Men Women Year of Death Year of Last Contact Year of Death Year of Last Contact 5 8 19 4 12 17 20 9 14 24 21 14 23 26 24 15 29 26 17 27 19 29 21 30 22 30 24 30 25 30 a) Estimate the survival functions for each treatment group using the Kaplan-Meier approach. b) Test whether there is a significant difference in survival between treatment groups using the log rank test and a 5 percent…arrow_forwardZane is examining two studies involving how different generations classify specified items as either luxuries or necessities. In the first study, generation A is defined to be people ages 18–29. The second study defined generation A to be people ages 22–33. Zane notices that the first study was conducted in 2002 while the second one was conducted in 2006 (a) According to the 2002 study, what are the birth years of generation A? The Sand Canyon Archaeological Project, edited by W. D. Lipe and published by Crow Canyon Archaeological Center, contains the stem-and-leaf diagram shown below. The study uses tree rings to accurately determine the year in which a tree was cut. The figure gives the tree-ring-cutting dates for samples of timbers found in the architectural units at Sand Canyon Pueblo. The text referring to the figure says, "The three-digit numbers in the left column represent centuries and decades A.D. The numbers to the right represent individual years, with each number derived…arrow_forward
- A CBS News poll conducted June 10 and 11, 2006, among a nationwide random sarmple of 651 adults, asked those adults about their party affiliation (Democrat, Republican or none) and their opinion of how the US economy was changing ("getting better," getting worse" or "about the same"). The results are shown in the table below.arrow_forward2.62 For the period 2001–2008, the Bristol-Myers Squibb Company, Inc. reported the following amounts (in billions of dollars) for (1) net sales and (2) advertising and product promotion. The data are also in the file XR02062. Source: Bristol-Myers Squibb Company, Annual Reports, 2005, 2008. Year Net Sales Advertising/Promotion 2001 $16.612 $1.201 2002 16.208 1.143 2003 18.653 1.416 2004 19.380 1.411 2005 19.207 1.476 2006 16.208 1.304 2007 18.193 1.415 2008 20.597 1.550 For these data, construct a line graph that shows both net sales and expenditures for advertising/product promotion over time. Some would suggest that increases in advertising should be accompanied by increases in sales. Does your line graph support this?arrow_forwardBecause of high tuition costs at state and private universities, enrollments atcommunity colleges have increased dramatically in recent years. The following data show theenrollment (in thousands) for Jefferson Community College from 2001–2009:Year Period (t) Enrollment (1000s)2001 1 6.52002 2 8.12003 3 8.42004 4 10.22005 5 12.52006 6 13.32007 7 13.72008 8 17.22009 9 18.1Compute F10: the Forecast for 2010. Compute Pearson’s Correlation Coefficient Use the Method of Least Squares to obtain the Best-Fit-Line for this data. Use the line to compute the forecast.arrow_forward
- DATAfile: TelevisionViewing Nielsen tracks the amount of time that people spend consuming media content across different platforms (digital, audio, television) in the United States. Nielsen has found that traditional television viewing habits vary based on the age of the consumer as an increasing number of people consume media through streaming devices.† The following data represent the weekly traditional TV viewing hours in 2016 for a sample of 14 people aged 18–34 and 12 people aged 35–49. (Round your answers to two decimal places.) Viewers aged 18–34 24.2 21.0 17.8 19.6 23.4 19.1 14.6 27.1 19.2 18.3 22.9 23.4 17.3 20.5 Viewers aged 35–49 24.9 34.9 35.8 31.9 35.4 29.9 30.9 36.7 36.2 33.8 29.5 30.8 (a) Compute the mean and median weekly hours of traditional TV viewed by those aged 18–34. mean hrmedian hr (b) Compute the mean and median weekly hours of traditional TV viewed by those aged 35–49. (Round your mean to two decimal places.) mean…arrow_forwardHeart rate during laughter. Laughter is often called “the best medicine,” since studies have shown that laughter can reduce muscle tension and increase oxygenation of the blood. In the International Journal of Obesity (Jan. 2007), researchers at Vanderbilt University investigated the physiological changes that accompany laughter. Ninety subjects (18–34 years old) watched film clips designed to evoke laughter. During the laughing period, the researchers measured the heart rate (beats per minute) of each subject, with the following summary results: Mean = 73.5, Standard Deviation = 6. n=90 (we can treat this as a large sample and use z) It is well known that the mean resting heart rate of adults is 71 beats per minute. Based on the research on laughter and heart rate, we would expect subjects to have a higher heart beat rate while laughing.Construct 95% Confidence interval using z value. What is the lower bound of CI? a) Calculate the value of the test statistic.(z*) b) If…arrow_forwardA researcher is conducting a test to see if handedness (right or left) affects the speed at which people perform a particular task. The researcher only knows the order in which the contestants finished. When the data are summarized (with R for right-handed and L for left-handed) the order of finishing (fastest to slowest) was: R, R, R, R, L, R, L, R, L, L Is there statistically significant evidence of an effect of handedness on the speed? Test statistic: The name of the statistical table, degrees of freedom (if appropriate), and the numerical value of the critical value for this test: P-value: Circle an appropriate conclusion: • There is significant evidence that left-handed contestants will finish the task faster. • We cannot reject the hypothesis that handedness has no effect on the time to finish the task. • There is significant evidence that right-handed contestants will finish the task faster.arrow_forward
- A researcher examined automobile accidents by studying whether drivers had been drinking alcohol (yes, no) and the time of the accident (7 a.m., 12 p.m., 6 p.m., or 3 a.m.). How many main effects are possible in this study? 1 3. 4. 8.arrow_forwardExercise 2. Find the mode for each example below.(a) The following data represent the number of O-ring failures on the shuttle Columbia for its 17 flights prior to its fatal flight:0, 0, 0, 0, 0, 0, 0, 0, 0, 0, 0, 1, 1, 1, 1, 2, 3(b) The data of the test scores from above:82, 77, 90, 71, 62, 68, 74, 84, 94, 88(c) Hair color of ten people in line:Brown, Blonde, Red, Brown, Brown,Blonde, Brown, Blonde, Blonde, Redarrow_forwardThe Reviews editor for a certain scientific journal decides whether the review for any particular book should be short (1–2 pages), medium (3–4 pages), or long (5–6 pages). Data on recent reviews indicates that 60% of them are short, 30% are medium, and the other 10% are long. Reviews are submitted in either Word or LaTeX. For short reviews, 80% are in Word, whereas 50% of medium reviews are in Word and 20% of long reviews are in Word. Suppose a recent review is randomly selected. (a) What is the probability that the selected review was submitted in Word format? (b) If the selected review was submitted in Word format, what are the posterior probabilities of it being short, medium, or long? (Round your answers to three decimal places.) short: medium: long:arrow_forward
 Calculus For The Life SciencesCalculusISBN:9780321964038Author:GREENWELL, Raymond N., RITCHEY, Nathan P., Lial, Margaret L.Publisher:Pearson Addison Wesley,