
Concept explainers
Videos
(a)
The event neither the dog’s fight drive nor its flight drives is strongest in explicit form as subsets of
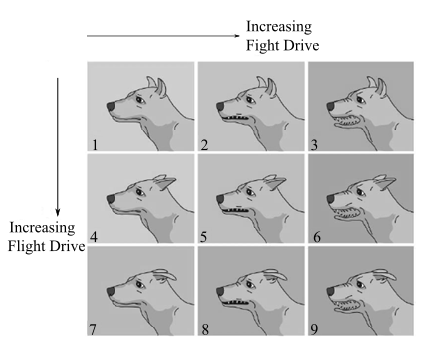
(b)
The event the dog’s fight drive is weakest but its flight drives is neither weakest nor strongest in explicit form as subsets of sample space where the figure shows the flight and fight drive of the dog and the fight drive increases from left to right and flight drive increases from top to bottom.

Trending nowThis is a popular solution!

Chapter 7 Solutions
Bundle: Finite Mathematics, Loose-leaf Version, 7th + WebAssign Printed Access Card for Waner/Costenoble's Finite Mathematics, 7th Edition, Single-Term


- In 2009, the population of the U.S., broken down by regions, was 54.6 million in the Northeast, 66.0 million in the Midwest, 111.8 million in the South, and 70.6 million in the West. The table below shows the population movement during the period 2008–2009. (Thus, 99.23% of the population in the Northeast stayed there, while 0.16% of the population in the Northeast moved to the Midwest, and so on.)† To Northeast Midwest South West From Northeast 0.9923 0.0016 0.0042 0.0019 Midwest 0.0018 0.9896 0.0047 0.0039 South 0.0056 0.0059 0.9827 0.0058 West 0.0024 0.0033 0.0044 0.9899 Use matrix inversion and multiplication to estimate the population in each region in 2008. (Round all answers to the nearest 0.1 million.) SEE PICTURE!!!arrow_forwardInternational Visitors The number of internationalvisitors to the United States for selected years 1986–2010 is given in the table below. If you had to pick one of these models to predictthe number of international visitors in the year2020, which model would be the more reasonablechoice?arrow_forwardZane is examining two studies involving how different generations classify specified items as either luxuries or necessities. In the first study, generation A is defined to be people ages 18–29. The second study defined generation A to be people ages 22–33. Zane notices that the first study was conducted in 2002 while the second one was conducted in 2006 (a) According to the 2002 study, what are the birth years of generation A? The Sand Canyon Archaeological Project, edited by W. D. Lipe and published by Crow Canyon Archaeological Center, contains the stem-and-leaf diagram shown below. The study uses tree rings to accurately determine the year in which a tree was cut. The figure gives the tree-ring-cutting dates for samples of timbers found in the architectural units at Sand Canyon Pueblo. The text referring to the figure says, "The three-digit numbers in the left column represent centuries and decades A.D. The numbers to the right represent individual years, with each number derived…arrow_forward
- Because of high tuition costs at state and private universities, enrollments atcommunity colleges have increased dramatically in recent years. The following data show theenrollment (in thousands) for Jefferson Community College from 2001–2009:Year Period (t) Enrollment (1000s)2001 1 6.52002 2 8.12003 3 8.42004 4 10.22005 5 12.52006 6 13.32007 7 13.72008 8 17.22009 9 18.1Compute F10: the Forecast for 2010. Compute Pearson’s Correlation Coefficient Use the Method of Least Squares to obtain the Best-Fit-Line for this data. Use the line to compute the forecast.arrow_forwardA CBS News poll conducted June 10 and 11, 2006, among a nationwide random sarmple of 651 adults, asked those adults about their party affiliation (Democrat, Republican or none) and their opinion of how the US economy was changing ("getting better," getting worse" or "about the same"). The results are shown in the table below.arrow_forward2.62 For the period 2001–2008, the Bristol-Myers Squibb Company, Inc. reported the following amounts (in billions of dollars) for (1) net sales and (2) advertising and product promotion. The data are also in the file XR02062. Source: Bristol-Myers Squibb Company, Annual Reports, 2005, 2008. Year Net Sales Advertising/Promotion 2001 $16.612 $1.201 2002 16.208 1.143 2003 18.653 1.416 2004 19.380 1.411 2005 19.207 1.476 2006 16.208 1.304 2007 18.193 1.415 2008 20.597 1.550 For these data, construct a line graph that shows both net sales and expenditures for advertising/product promotion over time. Some would suggest that increases in advertising should be accompanied by increases in sales. Does your line graph support this?arrow_forward
- DATAfile: TelevisionViewing Nielsen tracks the amount of time that people spend consuming media content across different platforms (digital, audio, television) in the United States. Nielsen has found that traditional television viewing habits vary based on the age of the consumer as an increasing number of people consume media through streaming devices.† The following data represent the weekly traditional TV viewing hours in 2016 for a sample of 14 people aged 18–34 and 12 people aged 35–49. (Round your answers to two decimal places.) Viewers aged 18–34 24.2 21.0 17.8 19.6 23.4 19.1 14.6 27.1 19.2 18.3 22.9 23.4 17.3 20.5 Viewers aged 35–49 24.9 34.9 35.8 31.9 35.4 29.9 30.9 36.7 36.2 33.8 29.5 30.8 (a) Compute the mean and median weekly hours of traditional TV viewed by those aged 18–34. mean hrmedian hr (b) Compute the mean and median weekly hours of traditional TV viewed by those aged 35–49. (Round your mean to two decimal places.) mean…arrow_forwardHeart rate during laughter. Laughter is often called “the best medicine,” since studies have shown that laughter can reduce muscle tension and increase oxygenation of the blood. In the International Journal of Obesity (Jan. 2007), researchers at Vanderbilt University investigated the physiological changes that accompany laughter. Ninety subjects (18–34 years old) watched film clips designed to evoke laughter. During the laughing period, the researchers measured the heart rate (beats per minute) of each subject, with the following summary results: Mean = 73.5, Standard Deviation = 6. n=90 (we can treat this as a large sample and use z) It is well known that the mean resting heart rate of adults is 71 beats per minute. Based on the research on laughter and heart rate, we would expect subjects to have a higher heart beat rate while laughing.Construct 95% Confidence interval using z value. What is the lower bound of CI? a) Calculate the value of the test statistic.(z*) b) If…arrow_forwardA neighborhood is trying to set up school carpools, but they need to determine the number of students who need to travel to the elementary school (ages 5–10), the middle school (ages 11–13), and the high school (ages 14–18). A histogram summarizes their findings: Histogram titled Carpool, with Number of Children on the y axis and Age Groups on the x axis. Bar 1 is 5 to 10 years old and has a value of 3. Bar 2 is 11 to 13 years old and has a value of 7. Bar 3 is 14 to 18 years old and has a value of 4. Which of the following data sets is represented in the histogram? A. {3, 3, 3, 7, 7, 7, 7, 7, 7, 7, 4, 4, 4, 4} B. {5, 10, 4, 11, 12, 13, 12, 13, 12, 11, 14, 14, 19, 18} C. {5, 6, 5, 11, 12, 13, 12, 13, 14, 15, 11, 18, 17, 13} D. {3, 5, 10, 11, 13, 7, 18, 14, 4}arrow_forward
- . e-Filing Tax Returns The Internal Revenue ServiceRestructuring and Reform Act (RRA) was signed intolaw by President Bill Clinton in 1998. A major objective ofthe RRA was to promote electronic filing of tax returns.The data in the table that follows show the percentage ofindividual income tax returns filed electronically for filingyears 2004–2012. Since the percentage P of returns filedelectronically depends on the filing year y, and each inputcorresponds to exactly one output, the percentage ofreturns filed electronically is a function of the filing year; soP1y2 represents the percentage of returns filed electronicallyfor filing year y.(a) Find the average rate of change of the percentage ofe-filed returns from 2004 to 2006.(b) Find the average rate of change of the percentage ofe-filed returns from 2007 to 2009.(c) Find the average rate of change of the percentage ofe-filed returns from 2010 to 2012.(d) What is happening to the average rate of change as timepasses?arrow_forwardA researcher is conducting a test to see if handedness (right or left) affects the speed at which people perform a particular task. The researcher only knows the order in which the contestants finished. When the data are summarized (with R for right-handed and L for left-handed) the order of finishing (fastest to slowest) was: R, R, R, R, L, R, L, R, L, L Is there statistically significant evidence of an effect of handedness on the speed? Test statistic: The name of the statistical table, degrees of freedom (if appropriate), and the numerical value of the critical value for this test: P-value: Circle an appropriate conclusion: • There is significant evidence that left-handed contestants will finish the task faster. • We cannot reject the hypothesis that handedness has no effect on the time to finish the task. • There is significant evidence that right-handed contestants will finish the task faster.arrow_forwardA researcher examined automobile accidents by studying whether drivers had been drinking alcohol (yes, no) and the time of the accident (7 a.m., 12 p.m., 6 p.m., or 3 a.m.). How many main effects are possible in this study? 1 3. 4. 8.arrow_forward
 Calculus For The Life SciencesCalculusISBN:9780321964038Author:GREENWELL, Raymond N., RITCHEY, Nathan P., Lial, Margaret L.Publisher:Pearson Addison Wesley,