
Videos
(a)
Check the
Check the standard deviation by using the calculator.
(a)
Explanation of Solution
Calculation:
Let variable x denotes crime rates.
Mean:
Use Ti 83 calculator tofind the mean as follows:
- Select STAT>Edit> Enter the values of Rate as L1.
- Click
- Click
- Click Enter.
Output using Ti 83 calculator is given below:
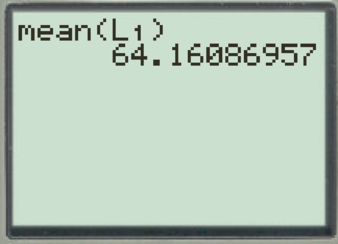
From the Ti 83 calculator output, the mean value is approximately 64.2 crimes per 1000 population.
Standard deviation:
Use Ti 83 calculator tofind the standard deviation as follows:
- Select STAT>Edit> Enter the values of Rate as L1.
- Click
- Click
- Click Enter.
Output using Ti 83 calculator is given below:
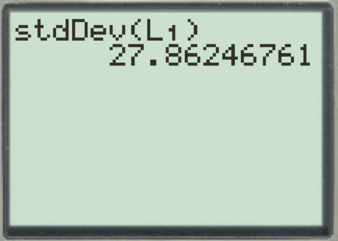
From the Ti 83 calculator output, the standard deviation value is approximately 27.9 crimes per 1000 population.
Hence, the sample mean and the sample standard deviation by using the calculator is verified.
(b)
Find the 80% confidence intervalfor the population mean crime rate for all Denver neighborhoods.
(b)
Answer to Problem 20P
The 80% confidence intervalfor the population mean crime rate for all Denver neighborhoodsis
Explanation of Solution
Calculation:
Confidence interval:
The confidence interval formula is,
In the formula
Let
Critical value:
The degrees of freedom is,
Use the Appendix II: Tables, Table 6: Critical Values for Student’s t Distribution:
- In d.f. column locate the value 45.
- In c row of locate the value 0.800.
- The intersecting value of row and columns is 1.301.
The critical value is
The error is,
Confidence interval:
Substitute
Hence, the 80% confidence intervalfor the population mean crime rate for all Denver neighborhoods is
(c)
Explain whether the crime rate 57 is belowthe average population crime rate or not.
Explain whether fewer patrols can be assigned neighbourhood or not.
(c)
Explanation of Solution
From part (b), the 80% confidence intervalcrime rate is
The rate of crime in neighbourhood is 57 crimes per 1,000 population. The value 57 is slightly less than the lower bound of 80% confidence interval. May be fewer patrols could be assigned to neighbourhood, but cannot determine how far it could be safe as 57 is closer to lower bound.
(d)
Explain whether the crime rate 75 is above the average population crime rate or not.
Explain whether more patrols should be assigned neighbourhood or not.
(d)
Explanation of Solution
From part (b), the 80% confidence intervalcrime rate is
The rate of crime in neighbourhood is 75 crimes per 1,000 population. The value 75 is larger than the upper bound of 80% confidence interval. This shows that, more patrols could be assigned to neighbourhood because of higher crime rate.
(e)
Find the 80% confidence intervalfor the population mean crime rate for all Denver neighborhoods.
Explain whether the crime rate 57 is belowthe average population crime rate or not.
Explain whether fewer patrols can be assigned neighbourhood having crime rate of 57 or not.
Explain whether the crime rate 75 is above the average population crime rate or not.
Explain whether more patrols should be assigned neighbourhood having crime rate of 75 or not.
(e)
Answer to Problem 20P
The 95% confidence intervalfor the population mean crime rate for all Denver neighborhoodsis
Explanation of Solution
Calculation:
There are 46 samples in the data and the confidence level is 95%.
Critical value:
The degrees of freedom is,
Use the Appendix II: Tables, Table 6: Critical Values for Student’s t Distribution:
- In d.f. column locate the value 45.
- In c row of locate the value 0.950.
- The intersecting value of row and columns is 2.014.
The critical value is
The error is,
Confidence interval:
Substitute
Hence, the 95% confidence intervalfor the population mean crime rate for all Denver neighborhoods is
The 95% confidence interval for crime rate is
The rate of crime in neighbourhood is 57 crimes per 1,000 populations. The value 57 is within 95% confidence interval. This shows that, it is not necessary to assign patrols to neighbourhood.
The rate of crime in another neighbourhood is 75 crimes per 1,000 population. The value 75 is larger than the upper bound of 95% confidence interval. This shows that, more patrols could be assigned to neighbourhood because of higher crime rate.
(f)
Explain whether it is necessary to make any assumptions for the problem.
(f)
Answer to Problem 20P
No, it is not necessary to make any assumptions for the problem.
Explanation of Solution
A random sample of 46 Denver neighbourhoods is taken from the population.
Based on central limit theorem, the sample size n must be greater than or equal to 30 for making the distribution of sample means
In the scenario, the sample size is greater than 30. This shows that,
Want to see more full solutions like this?
Chapter 7 Solutions
Bundle: Understandable Statistics: Concepts And Methods, 12th + Webassign, Single-term Printed Access Card


 MATLAB: An Introduction with ApplicationsStatisticsISBN:9781119256830Author:Amos GilatPublisher:John Wiley & Sons Inc
 Probability and Statistics for Engineering and th...StatisticsISBN:9781305251809Author:Jay L. DevorePublisher:Cengage Learning
 Statistics for The Behavioral Sciences (MindTap C...StatisticsISBN:9781305504912Author:Frederick J Gravetter, Larry B. WallnauPublisher:Cengage Learning
 Elementary Statistics: Picturing the World (7th E...StatisticsISBN:9780134683416Author:Ron Larson, Betsy FarberPublisher:PEARSON
 The Basic Practice of StatisticsStatisticsISBN:9781319042578Author:David S. Moore, William I. Notz, Michael A. FlignerPublisher:W. H. Freeman
 Introduction to the Practice of StatisticsStatisticsISBN:9781319013387Author:David S. Moore, George P. McCabe, Bruce A. CraigPublisher:W. H. Freeman