
Concept explainers
Videos
(a)
Find the 90% confidence interval for
Find the 95% confidence interval for
Find the 99% confidence interval for
(a)
Answer to Problem 23P
The 90% confidence interval for
The 95% confidence interval for
The 99% confidence interval for
Explanation of Solution
Calculation:
For confidence level 90%:
Use Ti 83 calculator tofind the confidence interval as follows:
- Select STAT> take the arrow to the TEST menu and then enter ‘8’ numbered key.
- In Input, select Stats.
- Enter
- Enter C-Level as 0.90.
- Click Enter.
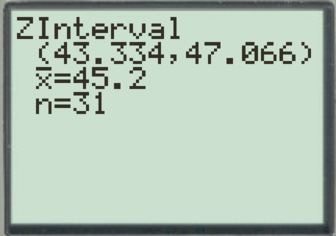
Output using Ti 83 calculator is given below:
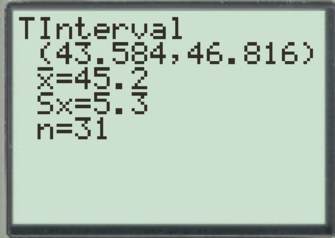
From the Ti 83 calculator output, the confidence interval is
Hence, the 90% confidence interval for
For confidence level 95%:
Use Ti 83 calculator tofind the confidence interval as follows:
- Select STAT> take the arrow to the TEST menu and then enter ‘8’ numbered key.
- In Input, select Stats.
- Enter
- Enter C-Level as 0.95.
- Click Enter.
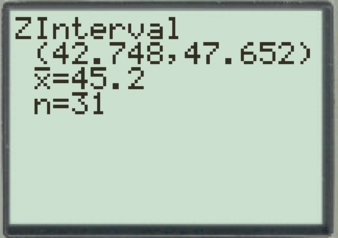
Output using Ti 83 calculator is given below:
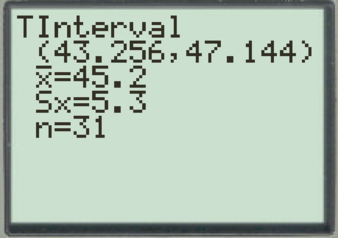
From the Ti 83 calculator output, the confidence interval is
Hence, the 95% confidence interval for
For confidence level 99%:
Use Ti 83 calculator tofind the confidence interval as follows:
- Select STAT> take the arrow to the TEST menu and then enter ‘8’ numbered key.
- In Input, select Stats.
- Enter
- Enter C-Level as 0.99.
- Click Enter.
Output using Ti 83 calculator is given below:
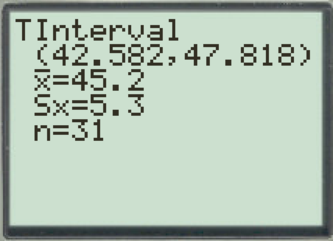
From the Ti 83 calculator output, the confidence interval is
Hence, the 99% confidence interval for
(b)
Find the 90% confidence interval for
Find the 95% confidence interval for
Find the 99% confidence interval for
(b)
Answer to Problem 23P
The 90% confidence interval for
The 95% confidence interval for
The 99% confidence interval for
Explanation of Solution
Calculation:
For confidence level 90%:
Use Ti 83 calculator tofind the confidence interval as follows:
- Select STAT> take the arrow to the TEST menu and then enter ‘7’ numbered key.
- In Input, select Stats.
- Enter
- Enter C-Level as 0.90.
- Click Enter.
Output using Ti 83 calculator is given below:
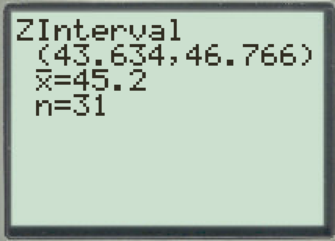
From the Ti 83 calculator output, the confidence interval is
Hence, the 90% confidence interval for
For confidence level 95%:
Use Ti 83 calculator tofind the confidence interval as follows:
- Select STAT> take the arrow to the TEST menu and then enter ‘7’ numbered key.
- In Input, select Stats.
- Enter
- Enter C-Level as 0.95.
- Click Enter.
Output using Ti 83 calculator is given below:
From the Ti 83 calculator output, the confidence interval is
Hence, the 95% confidence interval for
For confidence level 99%:
Use Ti 83 calculator tofind the confidence interval as follows:
- Select STAT> take the arrow to the TEST menu and then enter ‘7’ numbered key.
- In Input, select Stats.
- Enter
- Enter C-Level as 0.99.
- Click Enter.
Output using Ti 83 calculator is given below:
From the Ti 83 calculator output, the confidence interval is
Hence, the 99% confidence interval for
(c)
Compare the confidence intervals of the two methods.
Explain whether the confidence intervals using a Student’s t distribution are more conservative or not.
(c)
Explanation of Solution
Calculation:
From part (a), 90% confidence interval using method 1 is
The 95% confidence interval using method 1 is
The 99% confidence interval using method 1 is
From part (b), the 90% confidence interval using method 2is
The 95% confidence interval using method 2is
The 99% confidence interval using method 2is
It can be observed that, length of the confidence interval calculated using student’s t distribution is more when compared to standard normal distribution. This shows that, confidence intervals using a Student’s t distribution can be considered as more conservative with respect to length.
(d)
Find the 90% confidence interval for
Find the 95% confidence interval for
Find the 99% confidence interval for
Find the 90% confidence interval for
Find the 95% confidence interval for
Find the 99% confidence interval for
Compare the confidence intervals of the two methods.
Explain whether the confidence intervals using a Student’s t distribution are more conservative or not.
(d)
Answer to Problem 23P
The 90% confidence interval for
The 95% confidence interval for
The 99% confidence interval for
The 90% confidence interval for
The 95% confidence interval for
The 99% confidence interval for
Explanation of Solution
Calculation:
For confidence level 90%:
Use Ti 83 calculator tofind the confidence interval as follows:
- Select STAT> take the arrow to the TEST menu and then enter ‘8’ numbered key.
- In Input, select Stats.
- Enter
- Enter C-Level as 0.90.
- Click Enter.
Output using Ti 83 calculator is given below:
From the Ti 83 calculator output, the confidence interval is
Hence, the 90% confidence interval for
For confidence level 95%:
Use Ti 83 calculator tofind the confidence interval as follows:
- Select STAT> take the arrow to the TEST menu and then enter ‘8’ numbered key.
- In Input, select Stats.
- Enter
- Enter C-Level as 0.95.
- Click Enter.
Output using Ti 83 calculator is given below:
From the Ti 83 calculator output, the confidence interval is
Hence, the 95% confidence interval for
For confidence level 99%:
Use Ti 83 calculator tofind the confidence interval as follows:
- Select STAT> take the arrow to the TEST menu and then enter ‘8’ numbered key.
- In Input, select Stats.
- Enter
- Enter C-Level as 0.99.
- Click Enter.
Output using Ti 83 calculator is given below:
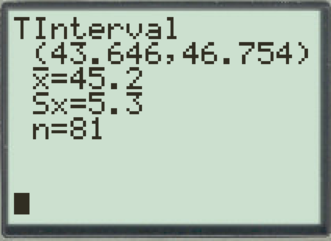
From the Ti 83 calculator output, the confidence interval is
Hence, the 99% confidence interval for
For confidence level 90%:
Use Ti 83 calculator tofind the confidence interval as follows:
- Select STAT> take the arrow to the TEST menu and then enter ‘7’ numbered key.
- In Input, select Stats.
- Enter
- Enter C-Level as 0.90.
- Click Enter.
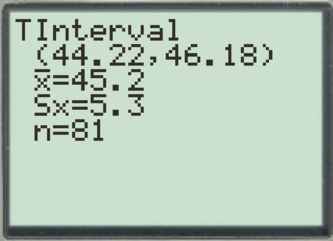
Output using Ti 83 calculator is given below:
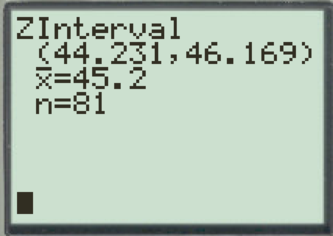
From the Ti 83 calculator output, the confidence interval is
Hence, the 90% confidence interval for
For confidence level 95%:
Use Ti 83 calculator tofind the confidence interval as follows:
- Select STAT> take the arrow to the TEST menu and then enter ‘7’ numbered key.
- In Input, select Stats.
- Enter
- Enter C-Level as 0.95.
- Click Enter.
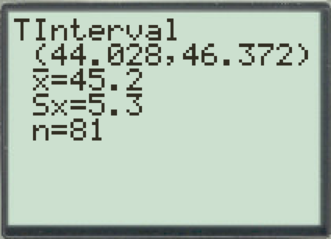
Output using Ti 83 calculator is given below:
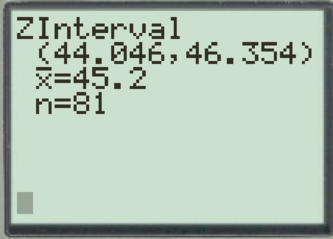
From the Ti 83 calculator output, the confidence interval is
Hence, the 95% confidence interval for
For confidence level 99%:
Use Ti 83 calculator tofind the confidence interval as follows:
- Select STAT> take the arrow to the TEST menu and then enter ‘7’ numbered key.
- In Input, select Stats.
- Enter
- Enter C-Level as 0.99.
- Click Enter.
Output using Ti 83 calculator is given below:
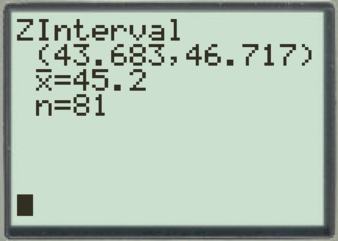
From the Ti 83 calculator output, the confidence interval is
Hence, the 99% confidence interval for
The 90% confidence interval using method 1for sample size 81 is
The 95% confidence interval using method 1for sample size 81 is
The 99% confidence interval using method 1for sample size 81 is
The 90% confidence interval using method 2for sample size 81 is
The 95% confidence interval using method 2for sample size 81 is
The 99% confidence interval using method 2for sample size 81 is
It can be observed that, length of the confidence interval calculated using student’s t distribution is more when compared to standard normal distribution. But the difference between the lengths of the confidence intervals is less for method 1 and 2 for sample size
Want to see more full solutions like this?
Chapter 7 Solutions
Bundle: Understandable Statistics: Concepts And Methods, 12th + Webassign, Single-term Printed Access Card


 MATLAB: An Introduction with ApplicationsStatisticsISBN:9781119256830Author:Amos GilatPublisher:John Wiley & Sons Inc
 Probability and Statistics for Engineering and th...StatisticsISBN:9781305251809Author:Jay L. DevorePublisher:Cengage Learning
 Statistics for The Behavioral Sciences (MindTap C...StatisticsISBN:9781305504912Author:Frederick J Gravetter, Larry B. WallnauPublisher:Cengage Learning
 Elementary Statistics: Picturing the World (7th E...StatisticsISBN:9780134683416Author:Ron Larson, Betsy FarberPublisher:PEARSON
 The Basic Practice of StatisticsStatisticsISBN:9781319042578Author:David S. Moore, William I. Notz, Michael A. FlignerPublisher:W. H. Freeman
 Introduction to the Practice of StatisticsStatisticsISBN:9781319013387Author:David S. Moore, George P. McCabe, Bruce A. CraigPublisher:W. H. Freeman