
Videos
To construct: the Venn diagram on the basis of given data using B = eats breakfast regularly and M = is male as the
Explanation of Solution
Given:
| Male | Female | Total | |
| Eat breakfast regularly | 190 | 110 | 300 |
| Don't eat breakfast regularly | 130 | 165 | 295 |
| Total | 320 | 275 | 595 |
Graph:
Venn diagram
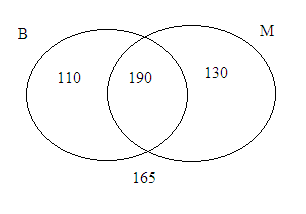
Drawing the two overlapping ellipses which name one is B and another is M. In the intersection area write the number of males who eat breakfast regularly. In the left side write the number of females who eat breakfast regularly and in the right side writes the number of males who do not breakfast regularly. Outside the ellipses write the number of females who do not eat breakfast regularly.
Chapter 7 Solutions
Statistics Through Applications
Additional Math Textbook Solutions
Statistics: The Art and Science of Learning from Data (4th Edition)
Introductory Statistics
Introductory Statistics (2nd Edition)
Intro Stats
Basic Business Statistics, Student Value Edition (13th Edition)


 MATLAB: An Introduction with ApplicationsStatisticsISBN:9781119256830Author:Amos GilatPublisher:John Wiley & Sons Inc
 Probability and Statistics for Engineering and th...StatisticsISBN:9781305251809Author:Jay L. DevorePublisher:Cengage Learning
 Statistics for The Behavioral Sciences (MindTap C...StatisticsISBN:9781305504912Author:Frederick J Gravetter, Larry B. WallnauPublisher:Cengage Learning
 Elementary Statistics: Picturing the World (7th E...StatisticsISBN:9780134683416Author:Ron Larson, Betsy FarberPublisher:PEARSON
 The Basic Practice of StatisticsStatisticsISBN:9781319042578Author:David S. Moore, William I. Notz, Michael A. FlignerPublisher:W. H. Freeman
 Introduction to the Practice of StatisticsStatisticsISBN:9781319013387Author:David S. Moore, George P. McCabe, Bruce A. CraigPublisher:W. H. Freeman