
Concept explainers
Videos
Ref erring to the previous exercise, let x and y be waiting times on two independently selected days. Define a new random variable w by
w =x + y
the sum of the two waiting times. The set of possible values for w is the interval from 0 to 40 (because both x and y can
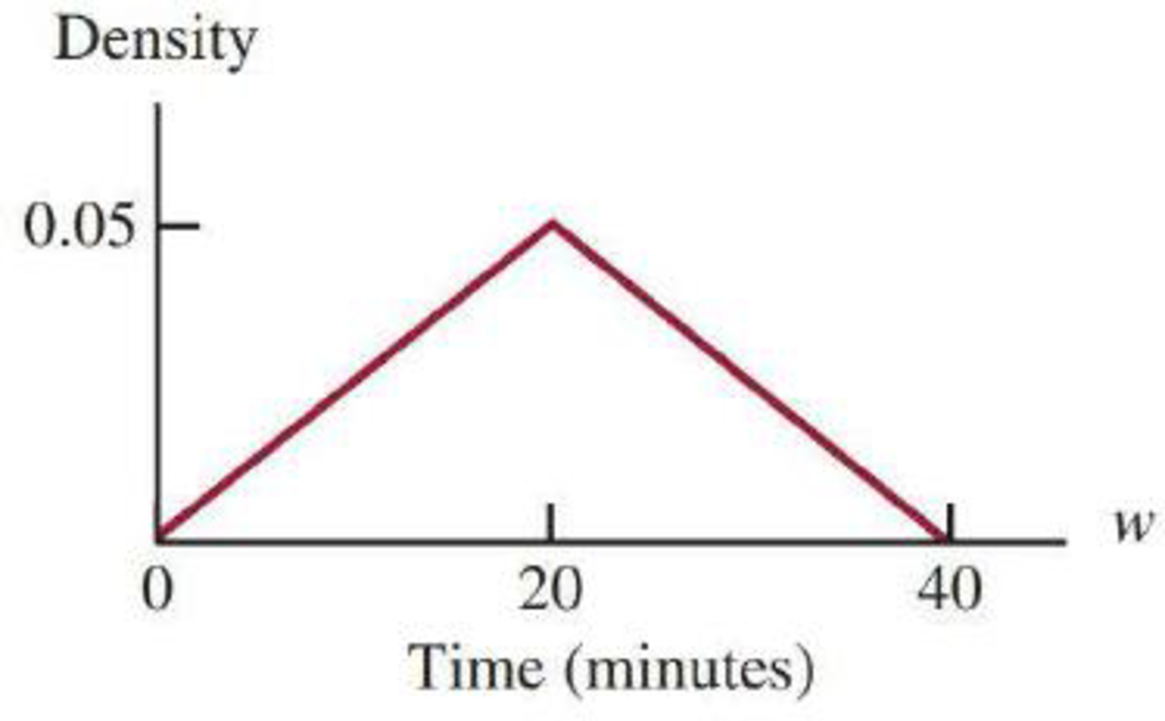
- a. Verify that the total area under the density curve is equal to 1.
(Hint: Area of a triangle =
- b. What is the
probability that w is less than 20? - c. What is the probability that w is less than 10?
- d. What is the probability that w is greater than 30?
7.30 Let x be the amount of time (in minutes) that a particular San Francisco commuter must wait for a train. Suppose that the density curve is as pictured (a uniform distribution):
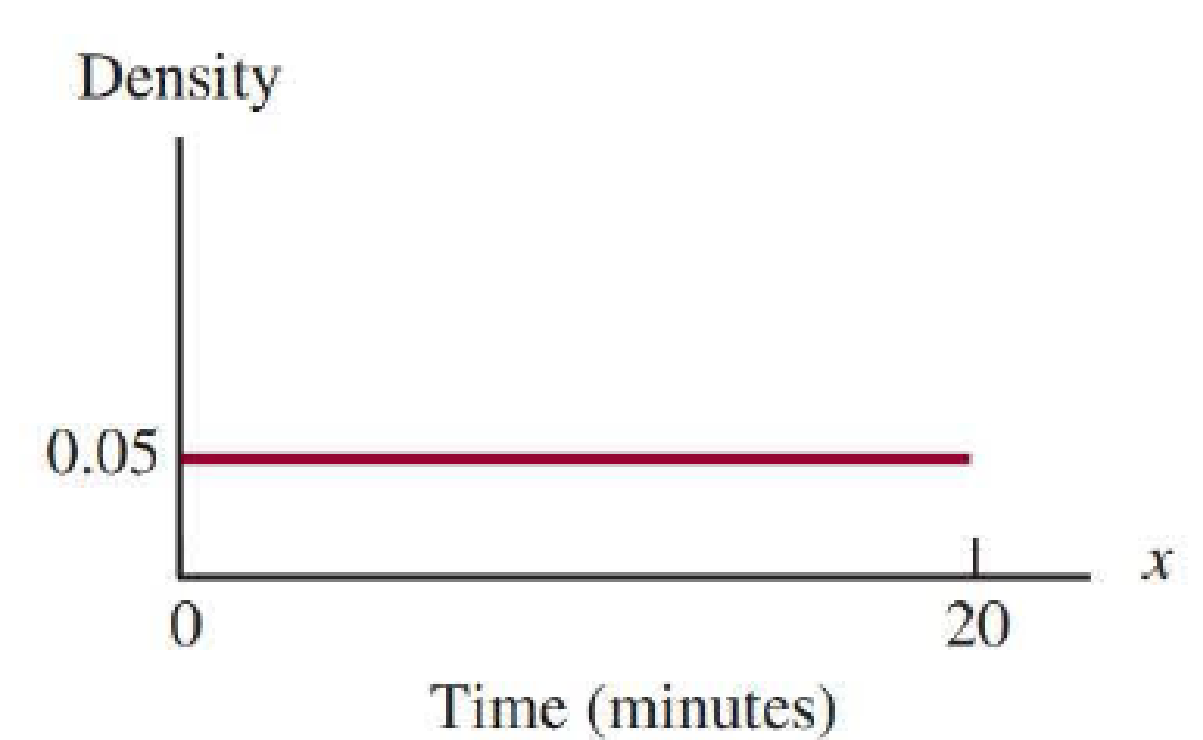
- a. What is the probability that x is less than 10 minutes? more than 15 minutes?
- b. What is the probability that x is between 7 and 12 minutes?
- c. Find the value c for which P(x < c) = 0.9.

Trending nowThis is a popular solution!

Chapter 7 Solutions
INTRODUCTION TO STATISTICS & DATA ANALYS


 MATLAB: An Introduction with ApplicationsStatisticsISBN:9781119256830Author:Amos GilatPublisher:John Wiley & Sons Inc
 Probability and Statistics for Engineering and th...StatisticsISBN:9781305251809Author:Jay L. DevorePublisher:Cengage Learning
 Statistics for The Behavioral Sciences (MindTap C...StatisticsISBN:9781305504912Author:Frederick J Gravetter, Larry B. WallnauPublisher:Cengage Learning
 Elementary Statistics: Picturing the World (7th E...StatisticsISBN:9780134683416Author:Ron Larson, Betsy FarberPublisher:PEARSON
 The Basic Practice of StatisticsStatisticsISBN:9781319042578Author:David S. Moore, William I. Notz, Michael A. FlignerPublisher:W. H. Freeman
 Introduction to the Practice of StatisticsStatisticsISBN:9781319013387Author:David S. Moore, George P. McCabe, Bruce A. CraigPublisher:W. H. Freeman