
Videos
Macular degeneration is the most common cause of blindness in people older than 60 years. One variable thought to be related to a type of inflammation associated with this disease is level of a substance called soluble Fas ligand (sFasL) in the blood.
The accompanying table contains representative data on x = sFasL level for 10 patients with age-related macular degeneration. These data are consistent with summary quantities and descriptions of the data given in the paper “Associations of Plasma-Soluble Fas Ligand with Aging and Age-Related Macular Degeneration” (Investigative Ophthalmology & Visual Science [2008]: 1345–1349).
The authors of the paper noted that the distribution of sFasL level was skewed and recommended a cube-root transformation. The cube-root values and the normal scores for a sample size of 10 are also given in the accompanying table.
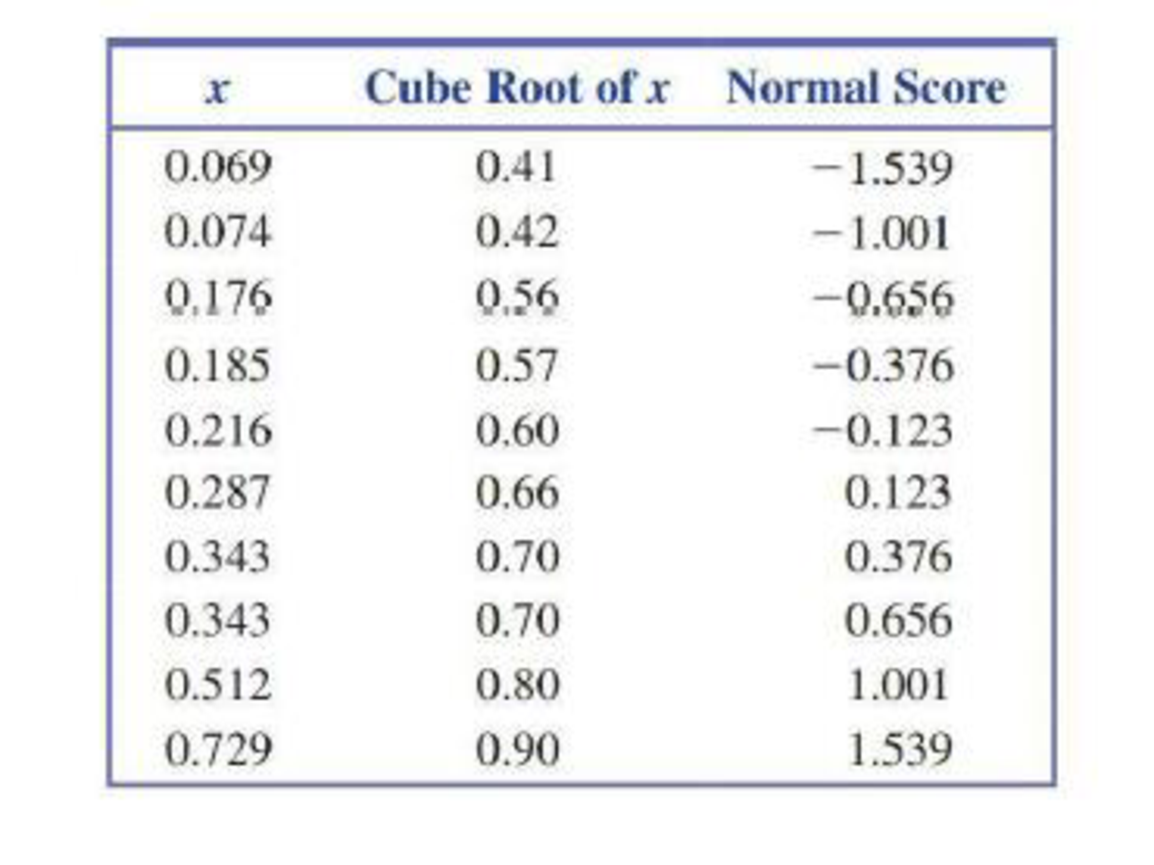
- a. Construct a normal
probability plot using the untransformed data. - b. Does the normal probability plot for the untransformed data appear linear or curved?
- c. Construct a normal probability plot using the cube-root transformed data. Does the normal probability plot appear more nearly linear than the plot for the untransformed data?

Trending nowThis is a popular solution!

Chapter 7 Solutions
INTRODUCTION TO STATISTICS & DATA ANALYS


- Recently there has been quite a bit of controversy about the lack of definitive knowledge about the adverse side effects associated with hormone based birth control usage. Suppose a researcher is interested in the effects of birth control in women aged 18-25 relevant to blood pressure. The researcher assumes that women in this demographic that are taking hormone based birth control are at risk for increased blood pressure. Assume the following table contains the summary statistics of two SRSs, one from a cohort of women taking hormone based birth control, and one from a cohort of women birth control free. Study Arm Average Systolic BP Sample Standard Deviation Sample Size Birth Control 124 6.8 246 No BC 116 4.3 267 a) Carry out the appropriate statistical procedure to determine if there is a significant difference in the systolic blood pressure between the two groups of women and write out a null and alternative hypotheses. (Use an alpha level of 0.05) b) Construct a 95%…arrow_forwardWhat is the observational study design used in the study Background: Vitamin D deficiency is prevalent among Indian women. Subclinical vitamin D deficiency is a significant risk factor for osteopenia and fractures. However, its effect on bone metabolism and bone mineral density (BMD) is still debatable. Objectives: This study aimed to determine relationships of the vitamin D status with bone turnover markers, carboxy-terminal telopeptide of type-I collagen (CTX), N-terminal propeptide of type I procollagen (PINP), and BMD in healthy Indian women. Methods: In this study, we determined serum levels of 25-hydroxy vitamin D (25(OH)D), parathyroid hormone, serum CTX, and PINP using commercial ELISA kits in 310 healthy Indian women aged 25 - 65 years who underwent BMD measurements with DXA scan. Results: The prevalence of vitamin D deficiency was 53.87%. A direct correlation of BMD with vitamin D levels was not observed. PINP negatively correlated with vitamin D in both premenopausal…arrow_forwardRecently there has been quite a bit of controversy about the lack of definitive knowledge about the adverse side effects associated with hormone-based birth control usage. Suppose a researcher is interested in the effects of birth control in women aged 18-25 relevant to blood pressure. The researcher assumes that women in this demographic that are taking hormone-based birth control are at risk for increased blood pressure. Assume the following table contains the summary statistics of two SRSs, one from a cohort of women taking hormone-based birth control, and one from a cohort of women birth control free. Study Arm Average Systolic Blood Pressure (mmHG) Sample Standard Deviation Sample Size Birth Control 124 6.8 246 No Birth Control 116 4.3 267 Carry out the appropriate statistical procedure to determine if there is a significant difference in the systolic blood pressure between the two groups of women. Write out your null and alternative…arrow_forward
- A group of disabled women ages 65 and older were followed for several years. It was found that those who had a vitamin B12 deficiency were twice as likely to suffer from severe depressions than those who did not.a. Describe the type of study being performed.b. Describe the explanatory variable(s) and response variable(s).arrow_forwardThe table below is from a study called “The Epidemiology of Social Stress.” The researchers in this study conduct a series of statistical tests to shed light on the association between social status variables (IVs) and depression (DVs). The left-hand column shows the tests for mean depressive symptom scores (Number of symptoms reported [range:0-50], higher levels indicate higher number of reported depressive symptoms) by sex, age, marital status, and occupational prestige. The right-hand column shows the tests for prevalence of major depressive disorder (has major depression=1; does not have major depression=0), broken down by sex, age, marital status, and occupational prestige. Examine the table and answer questions a)At alpha=.05, what can you conclude about the association between marital status and mean depressive symptom scores? Briefly summarize the findings, and provide a plausible, logical explanation (theory) for the observed association (or lack thereof). b)At alpha =.001,…arrow_forwardIn a recent study, investigators were interested in examining the association between blood glucose concentration at hospital admission and mortality in the hospital among patients with Sepsis in 3 Ugandan hospitals. Patients were followed from admission to the hospital until the end of the study. The study population included 418 admitted adult patients. Among the 280 patients with hyperglycemia (defined as a glucose concentration of >6.1 mmol/L), 80 died within the hospital from severe sepsis. Among the 138 patients with hypoglycemia (defined as a glucose concentration of <4.4 mmol/L), 30 died within the hospital from severe sepsis. Assume there is minimal loss to follow-up and no competing risks. What study design is described above? Prospective open cohort study Prospective closed cohort study Retrospective open cohort study Retrospective closed cohort study Case control studyarrow_forward
- In a recent study, investigators were interested in examining the association between blood glucose concentration at hospital admission and mortality in the hospital among patients with Sepsis in 3 Ugandan hospitals. Patients were followed from admission to the hospital until the end of the study. The study population included 418 admitted adult patients. Among the 280 patients with hyperglycemia (defined as a glucose concentration of >6.1 mmol/L), 80 died within the hospital from severe sepsis. Among the 138 patients with hypoglycemia (defined as a glucose concentration of <4.4 mmol/L), 30 died within the hospital from severe sepsis. Assume there is minimal loss to follow-up and no competing risks. a.Fill out a 2 x 2 table based on the description provided above. Label your exposure and outcome, and provide respective totals based on the study design.arrow_forwardCompute the value of the correlation coefficient between time spend for studyingand current CGPA and describe the relationship.arrow_forwardSeveral epidemiologists conducted a cohort study of the effect of mercury exposure on the development of brain cancer. Subjects were followed for ten years. There were a total of 150,000 people in the study. Among the subjects, 76,000 were exposed to mercury and the rest were not. 52,000 of those exposed to mercury developed brain cancer, and only 1,200 of those unexposed to mercury developed brain cancer. Please create a two-by-two table. Calculate the relative risk and interpret it in a sentence. Calculate the attributable risk and interpret. Calculate the percent attributable risk and interpret. Assume that 30% of people in Rhode Island are exposed to mercury, calculate and interpret the population attributable risk and calculate and interpret the percent population attributable risk.arrow_forward
- The Journal of American Medical Association published a study that examined a sample of pregnancies that resulted in the birth of twins. Births were classified as preterm with intervention (induced labor or cesarean), preterm without such procedures, or term or post term. Researchers also classified the pregnancies by the level of prenatal care the mother received (inadequate, adequate or intensive.) The data is summarized below. Figures are in thousands of births. Is there evidence of an association between the durations of the pregnancy and the level of care received by the mother? Preterm with procedures Preterm without procedures Term or post term Total Intensive 18 15 28 61 Adequate 46 43 65 154 Inadequate 12 13 38 63 Total 76 71 131 278arrow_forwardThe correlation coefficient between daily ration of green grass and rate of growing calves on the basis of observations taken on 10, 14, 16, 20, 25 and 28 cows at six farms were found to be 0.318, 0.106, 0.253, 0.340, 0.116 and 0.112. Can these be considered homogeneous ? If so, estimate the common correlation coefficient.arrow_forwardA five year study was conducted among 5,000 men older than 65 years to examine the relationship between heavy alcohol consumption and the onset of atrial fibrillation. The men were assessed each year. Men who drank heavily contributed a total of 12,500 person-years of observation and 250 of those who drank heavily developed atrial fibrillation. A total of 24,000 person-years were observed for the entire study. And 100 men who did not drink heavily developed atrial fibrillation. What was the incidence density among heavy drinking men? What was the incidence density among non-heavy drinking men? What was the rate ratio and interpret ?arrow_forward
 MATLAB: An Introduction with ApplicationsStatisticsISBN:9781119256830Author:Amos GilatPublisher:John Wiley & Sons Inc
 Probability and Statistics for Engineering and th...StatisticsISBN:9781305251809Author:Jay L. DevorePublisher:Cengage Learning
 Statistics for The Behavioral Sciences (MindTap C...StatisticsISBN:9781305504912Author:Frederick J Gravetter, Larry B. WallnauPublisher:Cengage Learning
 Elementary Statistics: Picturing the World (7th E...StatisticsISBN:9780134683416Author:Ron Larson, Betsy FarberPublisher:PEARSON
 The Basic Practice of StatisticsStatisticsISBN:9781319042578Author:David S. Moore, William I. Notz, Michael A. FlignerPublisher:W. H. Freeman
 Introduction to the Practice of StatisticsStatisticsISBN:9781319013387Author:David S. Moore, George P. McCabe, Bruce A. CraigPublisher:W. H. Freeman