
Concept explainers
Videos
(a)
To find:
The mean, median, mode, range, and standard deviation of the prices .
(a)
Answer to Problem 8Q
Mean
Explanation of Solution
Given:
The table
Concept used:
The mean of the squared deviation or variance
The square root of the variance
Calculation:
The mean is
Median
Mode
Range:-difference of largest and smallest value
The mean of the squared deviation or variance
| | | | |
| | | | |
| | | | |
| | | | |
| | | | |
| | | | |
| | | | |
| | | | |
| | | | |
The square root of the variance
(b)
To find:
The outlier affect the mean median and mode of the prices .
(b)
Answer to Problem 8Q
This is increases the mean and median and this is not affect the mode.
Explanation of Solution
Given:
The table
Concept used:
The mean of the squared deviation or variance
The square root of the variance
Calculation:
The mean is
Median
Mode
Range:-difference of largest and smallest value
The mean of the squared deviation or variance
| | | | |
| | | | |
| | | | |
| | | | |
| | | | |
| | | | |
| | | | |
| | | | |
| | | | |
The square root of the variance
The outlier is
Since this is greater than most of the data.
This is increases the mean and median and this is not affect the mode.
(c)
To find:
The interquartile range of the data and the shape of the distribution of the prices .
(c)
Answer to Problem 8Q
The distribution is skewed right.
Explanation of Solution
Given:
The table
Concept used:
The mean of the squared deviation or variance
The square root of the variance
Calculation:
Order the data
Least value
First quartile: median of lower half
Median
Third quartile: median of upper half
Greatest value
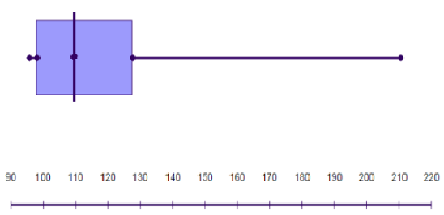 The right whisker is longer than the left whisker and most of the data are on the left side of the plot
Therefore,
The distribution is skewed right.
(d)
To find:
The mean, median, mode, range, and standard deviation of the prices.
(d)
Answer to Problem 8Q
Mean
Explanation of Solution
Given:
The table
Concept used:
The mean of the squared deviation or variance
The square root of the variance
Calculation:
In this case the data set is multiplied by
Each value in a numerical data set is multiplied by a real number
Where
The measures of center and variation is founded by multiplying the original measures by
Mean
Median
Mode
Range:-difference of largest and smallest value
The mean of the squared deviation or variance
| | | | |
| | | | |
| | | | |
| | | | |
| | | | |
| | | | |
| | | | |
| | | | |
| | | | |
The square root of the variance
Chapter 7 Solutions
BIG IDEAS MATH Integrated Math 1: Student Edition 2016


 Discrete Mathematics and Its Applications ( 8th I...MathISBN:9781259676512Author:Kenneth H RosenPublisher:McGraw-Hill Education
 Mathematics for Elementary Teachers with Activiti...MathISBN:9780134392790Author:Beckmann, SybillaPublisher:PEARSON
 Thinking Mathematically (7th Edition)MathISBN:9780134683713Author:Robert F. BlitzerPublisher:PEARSON
 Discrete Mathematics With ApplicationsMathISBN:9781337694193Author:EPP, Susanna S.Publisher:Cengage Learning,
 Pathways To Math Literacy (looseleaf)MathISBN:9781259985607Author:David Sobecki Professor, Brian A. MercerPublisher:McGraw-Hill Education