Understandable Statistics: Concepts and Methods
12th Edition
ISBN: 9781337119917
Author: Charles Henry Brase, Corrinne Pellillo Brase
Publisher: Cengage Learning
bartleby

Concept explainers

bartleby

Videos

Question
Book Icon
Chapter 7.4, Problem 7P

(a)

To determine

Identify the distribution that x¯1x¯2 follows if σ1 and σ2 are known.

(a)

Expert Solution
Check Mark

Explanation of Solution

Requirements:

  • When the distribution of x1 (population 1) and x2 (population 2) has the normal distribution with known population standard deviations σ1, σ2 then sampling distribution of x¯1x¯2 has the normal distribution for any sample sizes of n1,n2. The z distribution is used.
  • When the distribution of x1 (population 1) or x2 (population 2) are not normally distributed with known population standard deviations σ1, σ2 then sampling distribution of x¯1x¯2 has the normal distribution for sample sizes of n130,n230.

The variable x¯1x¯2 has the normal distribution with mean μ1μ2 and standard deviation σ12n1+σ22n2.

Two independent normal distributions are considered in the study. A random sample of size n1=20 is taken from first distribution with sample mean x¯1=12. Also, a random sample of size n2=25 is taken from second distribution with sample mean x¯1=14. The values of σ1,σ2 are known in the study.

The variable x¯1x¯2 has normal distribution because samples are independent of each other and the population standard deviations are known. Also, the population distributions are normally distributed.

(b)

To determine

Find the 90% confidence interval for μ1μ2.

(b)

Expert Solution
Check Mark

Answer to Problem 7P

The 90% confidence interval for μ1μ2 is 3.717<μ1μ2<0.283.

Explanation of Solution

Confidence interval:

The confidence interval for μ1μ2 when both σ1 and σ2 are known is,

(x¯1x¯2)E<μ1μ2<(x¯1x¯2)+E

In the formula, σ1 and σ2 are population standard deviations of populations 1 and 2, x¯1 and x¯2 are sample means from populations 1 and 2, n1 and n2 are sample sizes of population 1 and 2, E=zcσ12n1+σ22n2, c is confidence level, and zc is the critical value for confidence level c based on the standard normal distribution.

The confidence level is 90%.

Critical value:

Use the Appendix II: Tables, Table 5 (b): Confidence interval, Critical Values zc.

  • In the level of confidence c column, locate the value of 0.90, or 90%.
  • The corresponding Critical value zc is 1.645.

The value of zc is 1.645.

Substitute 20 for n1, 25 for n2, 3 for σ1, 4 for σ2, 1.645 for zc in the margin of error formula (E).

E=1.6453220+4225=1.645×1.09=1.645×1.044=1.717

The margin of error E is 1.717.

Substitute 12 for x¯1, 14 for x¯2, 1.717 for E in the confidence formula.

(1214)1.717<μ1μ2<(1214)+1.71721.717<μ1μ2<2+1.7173.717<μ1μ2<0.283

Hence, the 90% confidence interval for μ1μ2 is 3.717<μ1μ2<0.283.

(c)

To determine

Identify the distribution that x¯1x¯2 follows if σ1 and σ2 are not known.

Find the degrees of freedom.

(c)

Expert Solution
Check Mark

Answer to Problem 7P

The degrees of freedom are 19.

Explanation of Solution

Calculation:

The degrees of freedom formula is,

d.f.=smaller(n11,n21)

In the formula n1 and n2 are sample sizes of population 1 and 2.

Requirements:

  • When the distribution of x1 (population 1) and x2 (population 2) has the normal distribution or mounded shaped with unknown population standard deviations σ1, σ2 then sampling distribution of x¯1x¯2 has the normal distribution for any sample sizes of n1,n2. The student’s t distribution is used.
  • When the distribution of x1 (population 1) or x2 (population 2) are not normally distributed with unknown population standard deviations σ1, σ2 then sampling distribution of x¯1x¯2 has the normal distribution for sample sizes of n130,n230. Also, σ1 is replaced with s1 and σ2 is replaced with s2.

The variable x¯1x¯2 has the normal distribution with mean μ1μ2 and standard deviation s12n1+s22n2.

Two independent normal distributions are considered in the study. A random sample of size n1=20 is taken from first distribution with sample mean x¯1=12. Also, a random sample of size n2=25 is taken from second distribution with sample mean x¯1=14. The values of σ1,σ2 are not known in the study.

The variable x¯1x¯2 has student’s t distribution because the population distributions are normally distributed and the population standard deviations are not known.

Substitute 20 for n1, 25 for n2 in the degrees of freedom formula.

d.f.=smaller(201,251)=smaller(19,24)=19

Hence, the degrees of freedom are 19.

(d)

To determine

Find the 90% confidence interval for μ1μ2.

(d)

Expert Solution
Check Mark

Answer to Problem 7P

The 90% confidence interval for μ1μ2 is 3.805<μ1μ2<0.195.

Explanation of Solution

Confidence interval:

The confidence interval for μ1μ2 when both σ1 and σ2 are unknown is,

(x¯1x¯2)E<μ1μ2<(x¯1x¯2)+E

In the formula, s1 and s2 are sample standard deviations of populations 1 and 2, x¯1 and x¯2 are sample means from populations 1 and 2, n1 and n2 are sample sizes of population 1 and 2, E=tcσ12n1+σ22n2, c is confidence level, and tc is the critical value for confidence level c.

The confidence level is 90%.

Critical value:

Use the Appendix II: Tables, Table 6: Critical Values for Student’s t Distribution:

  • In d.f. column locate the value 19.
  • In c row of locate the value 0.90.
  • The intersecting value of row and columns is 1.729.

The critical value is 1.729.

Substitute 20 for n1, 25 for n2, 3 for s1, 4 for s2, 1.729 for tc in the margin of error formula (E).

E=1.7293220+4225=1.729×1.09=1.729×1.044=1.805

The margin of error E is 1.805.

Substitute 12 for x¯1, 14 for x¯2, 1.805 for E in the confidence formula.

(1214)1.805<μ1μ2<(1214)+1.80521.805<μ1μ2<2+1.8053.805<μ1μ2<0.195

Hence, the 90% confidence interval for μ1μ2 is 3.805<μ1μ2<0.195.

(e)

To determine

Find the 90% confidence interval for μ1μ2 using degrees of freedom based on Satterthwaite’s approximation.

(e)

Expert Solution
Check Mark

Answer to Problem 7P

The 90% confidence interval for μ1μ2 using degrees of freedom based on Satterthwaite’s approximation is 3.755<μ1μ2<0.245.

Explanation of Solution

Confidence interval:

Use Ti 83 calculator to obtain the confidence interval as follows:

  • Select STAT, take the arrow to the TESTS menu, and then ‘0’ numbered key.
  • Select Stats under Inpt.
  • Enter x¯1 as 12, Sx1 as 3, and n1 as 20.
  • Enter x¯2 as 14, Sx2 as 4, and n2 as 25.
  • Enter C-Level as 0.90
  • Select No under Pooled.
  • Click Calculated.

Output using Ti 83 calculator is given below:

Understandable Statistics: Concepts and Methods, Chapter 7.4, Problem 7P

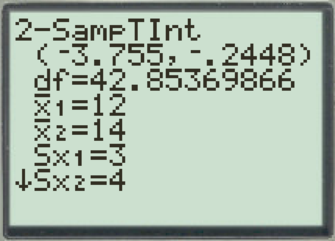
From Ti 83 calculator output, the confidence interval is (3.755,0.245).

Hence, the 90% confidence interval for μ1μ2 using degrees of freedom based on Satterthwaite’s approximation is 3.755<μ1μ2<0.245.

(f)

To determine

Identify whether there is 90% confident that μ1 is smaller than μ2.

(f)

Expert Solution
Check Mark

Explanation of Solution

All the confidence intervals calculated have negative values. The 90% confidence interval calculated for difference of means (μ1μ2) includes all the negative values, then μ1μ2<0. The relation between two population means is μ1<μ2. This shows that, there would be 90% sure that the average of first population (μ1) was less than the average of second population (μ2).

Hence, there is 90% confident that μ1 is smaller than μ2.

Want to see more full solutions like this?

Subscribe now to access step-by-step solutions to millions of textbook problems written by subject matter experts!

Chapter 7 Solutions

Understandable Statistics: Concepts and Methods

Ch. 7.1 - Basic Computation: Confidence Interval Suppose x...Ch. 7.1 - Basic Computation: Confidence Interval Suppose x...Ch. 7.1 - Basic Computation: Sample Size Suppose x has a...Ch. 7.1 - Basic Computation: Sample Size Suppose x has a...Ch. 7.1 - Zoology: Hummingbirds Allens hummingbird...Ch. 7.1 - Diagnostic Tests: Uric Acid Overproduction of uric...Ch. 7.1 - Diagnostic Tests: Plasma Volume Total plasma...Ch. 7.1 - Agriculture: Watermelon What price do farmers get...Ch. 7.1 - Prob. 19PCh. 7.1 - Confidence Intervals: Values of A random sample...Ch. 7.1 - Confidence Intervals: Sample Size A random sample...Ch. 7.1 - Ecology: Sand Dunes At wind speeds above 1000...Ch. 7.1 - Prob. 23PCh. 7.1 - Prob. 24PCh. 7.1 - Prob. 25PCh. 7.2 - Use Table 6 of Appendix II to find tc for a 0.95...Ch. 7.2 - Prob. 2PCh. 7.2 - Prob. 3PCh. 7.2 - Prob. 4PCh. 7.2 - Prob. 5PCh. 7.2 - Prob. 6PCh. 7.2 - Prob. 7PCh. 7.2 - Prob. 8PCh. 7.2 - Prob. 9PCh. 7.2 - Prob. 10PCh. 7.2 - Basic Computation: Confidence Interval Suppose x...Ch. 7.2 - Basic Computation: Confidence Interval A random...Ch. 7.2 - In Problems 1319, assume that the population of x...Ch. 7.2 - In Problems 1319, assume that the population of x...Ch. 7.2 - In Problems 1319, assume that the population of x...Ch. 7.2 - In Problems 1319, assume that the population of x...Ch. 7.2 - In Problems 1319, assume that the population of x...Ch. 7.2 - Prob. 18PCh. 7.2 - Prob. 19PCh. 7.2 - Prob. 20PCh. 7.2 - Prob. 21PCh. 7.2 - Prob. 22PCh. 7.2 - Prob. 23PCh. 7.3 - For all these problems, carry at least four digits...Ch. 7.3 - Prob. 2PCh. 7.3 - Prob. 3PCh. 7.3 - Prob. 4PCh. 7.3 - For all these problems, carry at least four digits...Ch. 7.3 - Prob. 6PCh. 7.3 - Prob. 7PCh. 7.3 - Prob. 8PCh. 7.3 - Prob. 9PCh. 7.3 - For all these problems, carry at least four digits...Ch. 7.3 - Prob. 11PCh. 7.3 - Prob. 12PCh. 7.3 - Prob. 13PCh. 7.3 - For all these problems, carry at least four digits...Ch. 7.3 - Prob. 15PCh. 7.3 - Prob. 16PCh. 7.3 - Prob. 17PCh. 7.3 - Prob. 18PCh. 7.3 - Prob. 19PCh. 7.3 - Prob. 20PCh. 7.3 - Prob. 21PCh. 7.3 - Prob. 22PCh. 7.3 - Prob. 23PCh. 7.3 - Prob. 24PCh. 7.3 - Prob. 25PCh. 7.3 - Prob. 26PCh. 7.3 - Prob. 27PCh. 7.3 - Prob. 28PCh. 7.4 - Prob. 1PCh. 7.4 - Prob. 2PCh. 7.4 - Prob. 3PCh. 7.4 - Prob. 4PCh. 7.4 - Prob. 5PCh. 7.4 - Prob. 6PCh. 7.4 - Prob. 7PCh. 7.4 - Prob. 8PCh. 7.4 - Prob. 9PCh. 7.4 - Prob. 10PCh. 7.4 - Prob. 11PCh. 7.4 - Prob. 12PCh. 7.4 - Prob. 13PCh. 7.4 - Prob. 14PCh. 7.4 - Prob. 15PCh. 7.4 - Prob. 16PCh. 7.4 - Answers may vary slightly due to rounding....Ch. 7.4 - Prob. 18PCh. 7.4 - Prob. 19PCh. 7.4 - Prob. 20PCh. 7.4 - Prob. 21PCh. 7.4 - Prob. 22PCh. 7.4 - Prob. 23PCh. 7.4 - Prob. 24PCh. 7.4 - Prob. 25PCh. 7.4 - Prob. 26PCh. 7.4 - Prob. 27PCh. 7.4 - Prob. 28PCh. 7.4 - Prob. 29PCh. 7.4 - Prob. 30PCh. 7.4 - Prob. 31PCh. 7 - Prob. 1CRPCh. 7 - Critical Thinking Suppose you are told that a 95%...Ch. 7 - Prob. 3CRPCh. 7 - Prob. 4CRPCh. 7 - Prob. 5CRPCh. 7 - For Problems 419, categorize each problem...Ch. 7 - Prob. 7CRPCh. 7 - For Problems 419, categorize each problem...Ch. 7 - Prob. 9CRPCh. 7 - For Problems 419, categorize each problem...Ch. 7 - For Problems 419, categorize each problem...Ch. 7 - For Problems 419, categorize each problem...Ch. 7 - Prob. 13CRPCh. 7 - Prob. 14CRPCh. 7 - Prob. 15CRPCh. 7 - For Problems 419, categorize each problem...Ch. 7 - Prob. 17CRPCh. 7 - Prob. 18CRPCh. 7 - Prob. 19CRPCh. 7 - Prob. 1DHCh. 7 - Prob. 2DHCh. 7 - Prob. 3DHCh. 7 - Prob. 1LCCh. 7 - Prob. 2LCCh. 7 - Prob. 3LCCh. 7 - Prob. 1UT
Knowledge Booster
Background pattern image
Statistics
Learn more about
Need a deep-dive on the concept behind this application? Look no further. Learn more about this topic, statistics and related others by exploring similar questions and additional content below.
Recommended textbooks for you
Text book image
MATLAB: An Introduction with Applications
Statistics
ISBN:9781119256830
Author:Amos Gilat
Publisher:John Wiley & Sons Inc
Text book image
Probability and Statistics for Engineering and th...
Statistics
ISBN:9781305251809
Author:Jay L. Devore
Publisher:Cengage Learning
Text book image
Statistics for The Behavioral Sciences (MindTap C...
Statistics
ISBN:9781305504912
Author:Frederick J Gravetter, Larry B. Wallnau
Publisher:Cengage Learning
Text book image
Elementary Statistics: Picturing the World (7th E...
Statistics
ISBN:9780134683416
Author:Ron Larson, Betsy Farber
Publisher:PEARSON
Text book image
The Basic Practice of Statistics
Statistics
ISBN:9781319042578
Author:David S. Moore, William I. Notz, Michael A. Fligner
Publisher:W. H. Freeman
Text book image
Introduction to the Practice of Statistics
Statistics
ISBN:9781319013387
Author:David S. Moore, George P. McCabe, Bruce A. Craig
Publisher:W. H. Freeman
Statistics 4.1 Point Estimators; Author: Dr. Jack L. Jackson II;https://www.youtube.com/watch?v=2MrI0J8XCEE;License: Standard YouTube License, CC-BY
Statistics 101: Point Estimators; Author: Brandon Foltz;https://www.youtube.com/watch?v=4v41z3HwLaM;License: Standard YouTube License, CC-BY
Central limit theorem; Author: 365 Data Science;https://www.youtube.com/watch?v=b5xQmk9veZ4;License: Standard YouTube License, CC-BY
Point Estimate Definition & Example; Author: Prof. Essa;https://www.youtube.com/watch?v=OTVwtvQmSn0;License: Standard Youtube License
Point Estimation; Author: Vamsidhar Ambatipudi;https://www.youtube.com/watch?v=flqhlM2bZWc;License: Standard Youtube License