
Statistics for Business and Economics (13th Edition)
13th Edition
ISBN: 9780134506593
Author: James T. McClave, P. George Benson, Terry Sincich
Publisher: PEARSON
expand_more
expand_more
format_list_bulleted
Concept explainers
Videos
Textbook Question
Chapter 7.5, Problem 7.57ACI
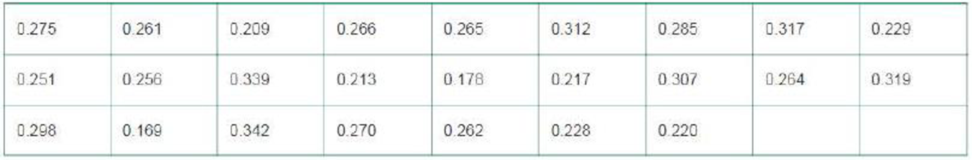
Oxygen bubble velocity in a purification process. Refer to the Chemical Engineering Research and Design (March 2013) study of a method of purifying nuclear fuel waste, Exercise 6.35 (p. 635). Recall that the process involves oxidation in molten salt and tends to produce oxygen bubbles with a rising velocity. To monitor the process, the researchers collected data on bubble velocity (measured in meters per second) for a random sample of 25 photographic bubble images. These data (simulated) are reproduced in the accompanying table. When oxygen is inserted into the molten salt at a rate (called the sparging rate) of the researchers discovered that the true mean bubble rising velocity is.
- a. Conduct a test of hypothesis to determine if the true mean bubble rising velocity for the population from which the sample is selected is μ = .338. Use α = .1 0.
- b. Based on the test results, part a, do you believe that the data in the table were generated at the sparging rate of 3.33 × 10⁻⁶? Explain.
Expert Solution & Answer
Want to see the full answer?
Check out a sample textbook solution
Students have asked these similar questions
The authors of the article “Predictive Model for PittingCorrosion in Buried Oil and Gas Pipelines”(Corrosion, 2009: 332–342) provided the data on whichtheir investigation was based.a. Consider the following sample of 61 observations onmaximum pitting depth (mm) of pipeline specimensburied in clay loam soil. 0.41 0.41 0.41 0.41 0.43 0.43 0.43 0.48 0.480.58 0.79 0.79 0.81 0.81 0.81 0.91 0.94 0.941.02 1.04 1.04 1.17 1.17 1.17 1.17 1.17 1.171.17 1.19 1.19 1.27 1.40 1.40 1.59 1.59 1.601.68 1.91 1.96 1.96 1.96 2.10 2.21 2.31 2.462.49 2.57 2.74 3.10 3.18 3.30 3.58 3.58 4.154.75 5.33 7.65 7.70 8.13 10.41 13.44Construct a stem-and-leaf display in which the twolargest values are shown in a last row labeled HI.b. Refer back to (a), and create a histogram based oneight classes with 0 as the lower limit of the firstclass and class widths of .5, .5, .5, .5, 1, 2, 5, and 5,respectively.c. The accompanying comparative boxplot fromMinitab shows plots of pitting depth for four differenttypes of soils.…
The NAEP considers that a national average of 283 is an acceptable performance. Using α = .05, run a two-tail t-test for one sample to test Ho: µ=283 for the 2019 scores. Report the t-obt, df, and p-values.
Would you reject the null hypothesis that the 2019 scores come from a population with average 283? If this is the case, does it come from a population from larger or smaller average?
In a study examining the effect of alcohol on reaction time, Liguori and Robinson (2001) found that even moderate alcohol consumption significantly slowed response time to an emergency situation in a driving simulation. In a similar study, researchers measured reaction time 30 minutes after participants consumed one 6-ounce glass of wine. Again, they used a standardized driving simulation task for which the regular population averages μ = 400 msec. The distribution of reaction times is approximately normal with σ = 40. Assume that the researcher obtained a sample mean of M = 422 for the n = 25 participants in the study. a. Are the data sufficient to conclude that the alcohol has a significant effect on reaction time? Use a two-tailed test with α = .01.
Chapter 7 Solutions
Statistics for Business and Economics (13th Edition)
Ch. 7.2 - Which hypothesis, the null or the alternative, is...Ch. 7.2 - Which element of a test of hypothesis is used to...Ch. 7.2 - What is the level of significance of a test of...Ch. 7.2 - What is the difference between Type I and Type II...Ch. 7.2 - List the four possible results of the combinations...Ch. 7.2 - We reject the null hypothesis when the test...Ch. 7.2 - If you test a hypothesis and reject the null...Ch. 7.2 - For each of the following rejection regions,...Ch. 7.2 - Use the applet Hypothesis Test for a Mean to...Ch. 7.2 - Americans favorite sport. The Harris Poll...
Ch. 7.2 - Play Golf America program. The Professional Golf...Ch. 7.2 - Student loan default rate. The national student...Ch. 7.2 - A border protection avatar. The National Center...Ch. 7.2 - Calories in school lunches. A University of...Ch. 7.2 - Libor interest rate. The interest rate at which...Ch. 7.2 - Prob. 7.15ACICh. 7.2 - Authorizing computer users with palm prints....Ch. 7.2 - Jury trial outcomes. Sometimes, the outcome of a...Ch. 7.2 - Intrusion detection systems. The Journal of...Ch. 7.3 - Consider the test of H0: = 7. For each of the...Ch. 7.3 - If a hypothesis test were conducted using = .05,...Ch. 7.3 - For each and observed significance level...Ch. 7.3 - In a test of the hypothesis H0: = 50 versus H0: ...Ch. 7.3 - In a test of H0: = 100 against Ha: 100 the...Ch. 7.3 - In a test of the hypothesis H0: = 10 versus Ha: ...Ch. 7.3 - In a test of H0: = 100 against Ha: 100, the...Ch. 7.3 - In a test of H0: = 75 performed using the...Ch. 7.3 - An analyst tested the null hypothesis that 20...Ch. 7.4 - Consider the test H0: = 70 versus Ha: 70 using...Ch. 7.4 - Suppose you are interested in conducting the...Ch. 7.4 - A random sample of 100 observations from a...Ch. 7.4 - A random sample of 64 observations produced the...Ch. 7.4 - Use the applet Hypotheses Test for a Mean to...Ch. 7.4 - Use the applet Hypotheses Test for a Mean to...Ch. 7.4 - Use the applet Hypotheses Test for a Mean to...Ch. 7.4 - Corporate sustainability of CPA firms. Refer to...Ch. 7.4 - Packaging of a childrens health food. Can...Ch. 7.4 - Stability of compounds in new drugs. Refer to the...Ch. 7.4 - Facial structure of CEOs. Refer to the...Ch. 7.4 - Trading skills of institutional investors. The...Ch. 7.4 - Producers and consumers risk. In quality-control...Ch. 7.4 - Unethical corporate conduct. Refer to the...Ch. 7.4 - Time required to complete a task. When a person is...Ch. 7.4 - Tipping points in daily deal transactions. Refer...Ch. 7.4 - Point spreads of NFL games. During the National...Ch. 7.4 - Revenue for a full-service funeral. According to...Ch. 7.4 - Buy-side vs. sell-side analysts earnings...Ch. 7.4 - Solder-joint inspections. Current technology uses...Ch. 7.4 - Prob. 7.45ACACh. 7.4 - Salaries of postgraduates. The Economics of...Ch. 7.5 - a. Consider testing H0: = 80. Under what...Ch. 7.5 - For each of the following rejection regions,...Ch. 7.5 - A random sample of n observations is selected from...Ch. 7.5 - A sample of five measurements, randomly selected...Ch. 7.5 - Suppose you conduct a 1-test for the null...Ch. 7.5 - Performance-based logistics. Refer to the Journal...Ch. 7.5 - Accidents at construction sites. In a study...Ch. 7.5 - Lobster trap placement. Refer to the Bulletin of...Ch. 7.5 - Radon exposure in Egyptian tombs. Refer to the...Ch. 7.5 - Performance of stock screeners. Recall, from...Ch. 7.5 - Oxygen bubble velocity in a purification process....Ch. 7.5 - Shopping vehicle and judgment. Refer to the...Ch. 7.5 - Minimizing tractor skidding distance. Refer to the...Ch. 7.5 - Crude oil biodegradation. Refer to the Journal of...Ch. 7.5 - Increasing hardness of polyester composites....Ch. 7.5 - Arsenic in smelters. The Occupational Safety and...Ch. 7.6 - Suppose a random sample of 100 observations from a...Ch. 7.6 - Suppose the sample in Exercise 7.64 has produced...Ch. 7.6 - A statistics student used a computer program to...Ch. 7.6 - Refer to Exercise 6.441 (p. 332), in which 50...Ch. 7.6 - For the binomial sample sizes and null...Ch. 7.6 - Use the applet Hypotheses Test for a Proportion to...Ch. 7.6 - Use the applet Hypotheses Test for a Proportion to...Ch. 7.6 - Customer participation in store loyalty card...Ch. 7.6 - Fraud survey of Asia-Pacific firms. The opinions...Ch. 7.6 - TV subscription streaming. Streaming of television...Ch. 7.6 - Gummi Bears: Red or yellow? Companies that produce...Ch. 7.6 - Toothpaste brands with the ADA seal. Consumer...Ch. 7.6 - Vacation-home owners. The National Association of...Ch. 7.6 - Organic-certified coffee. Coffee markets that...Ch. 7.6 - Dehorning of dairy calves. For safety reasons,...Ch. 7.6 - Effectiveness of skin cream. Ponds Age-Defying...Ch. 7.6 - Prob. 7.78ACICh. 7.6 - Prob. 7.79ACICh. 7.6 - Prob. 7.80ACACh. 7.6 - Prob. 7.81ACACh. 7.7 - Let X02 be a particular value of X2 Find the value...Ch. 7.7 - A random sample of n observations is selected from...Ch. 7.7 - A random sample of seven measurements gave x=9.4...Ch. 7.7 - Refer to Exercise 7.841. Suppose we had n = 100,...Ch. 7.7 - A random sample of n = 7 observations from a...Ch. 7.7 - Trading skills of institutional investors. Refer...Ch. 7.7 - Lobster trap placement. Refer to the Bulletin of...Ch. 7.7 - Prob. 7.89ACBCh. 7.7 - Oil content of fried sweet potato chips. Refer to...Ch. 7.7 - Strand bond performance of pre-stressed concrete....Ch. 7.7 - Drug content assessment. Refer to the Analytical...Ch. 7.7 - Jitter in a water power system. Refer to the...Ch. 7.7 - Cooling method for gas turbines. During periods of...Ch. 7.7 - Why do small firms export? The Journal of Small...Ch. 7.8 - a. List three factors that will increase the power...Ch. 7.8 - Prob. 7.97LMCh. 7.8 - Prob. 7.98LMCh. 7.8 - Prob. 7.99LMCh. 7.8 - Refer to Exercise 7.99. a. Find for each of the...Ch. 7.8 - Prob. 7.101LMCh. 7.8 - Prob. 7.102ACICh. 7.8 - Prob. 7.103ACICh. 7.8 - Prob. 7.104ACICh. 7.8 - Prob. 7.105ACICh. 7.8 - Prob. 7.106ACICh. 7.8 - Prob. 7.107ACICh. 7 - Specify the differences between a large-sample and...Ch. 7 - Complete the following statement; The smaller the...Ch. 7 - Which of the elements of a test of hypothesis can...Ch. 7 - If you select a very small value for when...Ch. 7 - If the rejection of the null hypothesis of a...Ch. 7 - A random sample of 20 observations selected from a...Ch. 7 - A random sample of 175 measurements possessed a...Ch. 7 - A random sample of n = 200 observations from a...Ch. 7 - A t-test is conducted for the null hypothesis H0 :...Ch. 7 - A random sample of 41 observations from a normal...Ch. 7 - Effectiveness of online courses. The Survey of...Ch. 7 - Prob. 7.119ACBCh. 7 - Latex allergy in health care workers. Refer to the...Ch. 7 - Latex allergy in health care workers (contd)....Ch. 7 - Made in the USA survey. Refer to the Journal of...Ch. 7 - Beta value of a stock. The beta coefficient of a...Ch. 7 - Accuracy of price scanners at Walmart. Refer to...Ch. 7 - Paying for music downloads. If you use the...Ch. 7 - Prob. 7.126ACBCh. 7 - Prob. 7.127ACBCh. 7 - Prob. 7.128ACICh. 7 - Prob. 7.129ACICh. 7 - Drivers use of the Lincoln Tunnel. The Lincoln...Ch. 7 - Prob. 7.131ACICh. 7 - Prob. 7.132ACICh. 7 - Prob. 7.133ACICh. 7 - Prob. 7.134ACICh. 7 - Prob. 7.135ACICh. 7 - Prob. 7.136ACICh. 7 - Prob. 7.137ACICh. 7 - Prob. 7.138ACICh. 7 - Prob. 7.139ACICh. 7 - Prob. 7.140ACICh. 7 - Prob. 7.141ACICh. 7 - Prob. 7.142ACICh. 7 - Prob. 7.143ACICh. 7 - Ages of cable TV shoppers. Cable TVs Home Shopping...Ch. 7 - Factors that inhibit learning in marketing. What...Ch. 7 - Prob. 7.146ACACh. 7 - The hot tamale caper. Hot tamales are chewy,...
Knowledge Booster


Learn more about
Need a deep-dive on the concept behind this application? Look no further. Learn more about this topic, statistics and related others by exploring similar questions and additional content below.Similar questions
- In a study examining the effect of alcohol on reaction time, Liguori and Robinson (2001) found that even moderate alcohol consumption significantly slowed response time to an emergency situation in a driving simulation. In a similar study, researchers measured reaction time 30 minutes after participants consumed one 6-ounce glass of wine. Again, they used a standardized driving simulation task for which the regular population averages μ = 400 msec. The distribution of reaction times is approximately normal with σ = 40. Assume that the researcher obtained a sample mean of M = 422 for the n = 25 participants in the study A) Are the data sufficient to conclude that the alcohol has a significant effect on reaction time? Use a two-tailed test with α = .01. B) Do the data provide evidence that the alcohol significantly increased reaction time? Use a one-tailed test with α = .01 C) Compute Cohen’s d to estimate the size of the effect.arrow_forwardIn a study examining the effect of alcohol on reaction time, Liguori and Robinson (2001) found that even moderate alcohol consumption significantly slowed response time to an emergency situation in a driving simulation. In a similar study, researchers measured reaction time 30 minutes after participants consumed one 6-ounce glass of wine. Again, they used a standardized driving simulation task for which the regular population averages µ = 400 msec. The distribution of reaction times is approximately normal with σ = 40. Assume that the researcher obtained a sample mean of M = 422 for the n = 25 participants in the study. a) Are the data sufficient to conclude that the alcohol has a significant effect on reaction time? Use a two-tailed test with α = .01 b) Do the data provide evidence that the alcohol significantly increased (slowed) reaction time? Use one-tailed test with α = .05arrow_forward(1) Conduct a hypothesis test, at the 5% level of significance, to determine whether ? is significant (2) What would be the growth of the plant if 4g of fertilizer and 7g of ater was given to it daily? (3) Carry out an F -test at the 1% significance level to determine whether the model is significantarrow_forward
- To combat antibiotic resistance, the Quality Improvement Consortium recommends a throat swab to confirm strep throat before a physician prescribes antibiotics to children under age 5. Nationally, 40 percent of children under 5 who received antibiotics did not have a throat swab. The Colorado Department of Health took a random sample of 60 children under the age of 5 who received antibiotics for throat infections and found that 18 did not have a throat swab. At α = .05, is this a statistically significant reduction over last year’s national rate of 40 percent? (a-1) Calculate the critical value. (A negative value should be indicated by a minus sign. Round your answer to 3 decimal places.) Critical value _____ (a-2) Calculate the test statistic. (A negative value should be indicated by a minus sign. Round your answer to 2 decimal places.) Test statistic _____arrow_forwardTo combat antibiotic resistance, the Quality Improvement Consortium recommends a throat swab to confirm strep throat before a physician prescribes antibiotics to children under age 5. Nationally, 40 percent of children under 5 who received antibiotics did not have a throat swab. The Colorado Department of Health took a random sample of 100 children under the age of 5 who received antibiotics for throat infections and found that 30 did not have a throat swab. At α = .05, is this a statistically significant reduction over last year’s national rate of 40 percent? (a-1) Choose the correct null and alternative hypotheses. H0: π ≥ .40 vs. H1: π < .40 H0: π ≤ .40 vs. H1: π > .40 H0: π = .40 vs. H1: π ≠ .40 (a-2) Calculate the critical value. (A negative value should be indicated by a minus sign. Round your answer to 3 decimal places.) Critical value (a-3) Calculate the test statistic. (A negative value should be indicated by a minus sign. Round your…arrow_forwardResearchers interested in lead exposure due to car exhaust sampled the blood of 52 police officers subjected to constant inhalation of automobile exhaust fumes while working traffic enforcement in a primarily urban environment. The blood samples of these officers had an average lead concentration of 124.32 µg/l and an SD of 37.74 µg/l; a previous study of individuals from a nearby suburb, with no history of exposure, found an average blood level concentration of 35 µg/l. Write down the hypotheses that would be appropriate for testing if the police officers appear to have been exposed to a higher concentration of lead. Explicitly state and check all conditions necessary for inference on these data. Test the hypothesis that the downtown police officers have a higher lead exposure than the group in the previous study. Interpret your results in context. Based on your preceding result, without performing a calculation, would a 99% confidence interval for the average blood concentration…arrow_forward
- In a study examining the effect of alcohol on reaction time, Liguori and Robinson (2001) found that evenmoderate alcohol consumption significantly slowed response time to an emergency situation in a drivingsimulation. In a similar study, researchers measured reaction time 30 minutes after participants consumed one6-ounce glass of wine. Again, they used a standardized driving simulation task for which the regular populationaverages μ = 400 msec. The distribution of reaction times is approximately normal with σ = 40. Assume that theresearcher obtained a sample mean of M = 422 for the n = 25 participants in the study.a. Are the data sufficient to conclude that the alcohol has a significant effect on reaction time? Use a two-tailed testwith α = .01.arrow_forwardA study on the oxygen consumption rate (OCR) of sea cucumbers involved a random sample of size 12 at 15oC and a second random sample of size 5 kept at 18oC. To test the hypothesis that this range of temperature had no effect on the OCR, what is the degrees of freedom for a two-sample t-test?arrow_forwardLactation promotes a temporary loss of bone mass to provide adequate amounts of calcium for milk production. The paper “Bone Mass Is Recovered from Lactation to Postweaning in Adolescent Mothers with Low Calcium Intakes” (Amer. J. of Clinical Nutr., 2004: 1322–1326) gave the following data on total body bone mineral content (TBBMC) (g) for a sample both during lactation (L) and in the postweaning period (P). SubjectL 1928 2549 2825 1924 1628 2175 2114 2621 1843 2541P 2126 2885 2895 1942 1750 2184 2164 2626 2006 2627 Does the data suggest that true average total body bone mineral content during postweaning exceeds that during lactation by more than 25 g? State and test the appropriate hypotheses using a significance level of .05.arrow_forward
- The median pH level of the rain in a certain county, was 4.90. A biologist obtains a random sample of 19 rain dates and obtains the following data. Test the hypothesis that the median pH level has decreased from 4.90 at the alpha= 0.05 level of significance.arrow_forwardThree samples of each of three types of PVC pipe of equal wall thickness are tested to failure under three temperature conditions, yielding the results shown below. Research questions: Is mean burst strength affected by temperature and/or by pipe type? Is there a “best” brand of PVC pipe? Burst Strength of PVC Pipes (psi) Temperature PVC1 PVC2 PVC3 Hot (70º C) 247 299 239 277 287 262 283 275 279 Warm (40º C) 325 341 297 322 319 315 296 335 304 Cool (10º C) 358 375 327 366 352 334 338 359 340 Click here for the Excel Data File (a-1) Choose the correct row-effect hypotheses. a. H0: A1 ≠ A2 ≠ A3 ≠ 0 ⇐⇐ Temperature means differ H1: All the Aj are equal to zero ⇐⇐ Temperature means are the same b. H0: A1 = A2 = A3 = 0 ⇐⇐ Temperature means are the same H1: Not all the Aj are equal to zero ⇐⇐ Temperature means differ a b (a-2) Choose the correct column-effect hypotheses. a. H0: B1 ≠ B2 ≠ B3 ≠ 0 ⇐⇐…arrow_forwardThe National Transportation Safety Board wants to look at the safety of three different sizes of cars. Using the data below, determine the whether the mean pressure applied to the driver`s head during a crash is equal for each type of car at alpha = 0.01 Compact cars Midsize cars Full-size Cars 643 469 484 655 427 456 702 525 402 a) Ho: Ha : b) Decision c) Conclusionarrow_forward
arrow_back_ios
SEE MORE QUESTIONS
arrow_forward_ios
Recommended textbooks for you
 MATLAB: An Introduction with ApplicationsStatisticsISBN:9781119256830Author:Amos GilatPublisher:John Wiley & Sons Inc
 Probability and Statistics for Engineering and th...StatisticsISBN:9781305251809Author:Jay L. DevorePublisher:Cengage Learning
 Statistics for The Behavioral Sciences (MindTap C...StatisticsISBN:9781305504912Author:Frederick J Gravetter, Larry B. WallnauPublisher:Cengage Learning
 Elementary Statistics: Picturing the World (7th E...StatisticsISBN:9780134683416Author:Ron Larson, Betsy FarberPublisher:PEARSON
 The Basic Practice of StatisticsStatisticsISBN:9781319042578Author:David S. Moore, William I. Notz, Michael A. FlignerPublisher:W. H. Freeman
 Introduction to the Practice of StatisticsStatisticsISBN:9781319013387Author:David S. Moore, George P. McCabe, Bruce A. CraigPublisher:W. H. Freeman
MATLAB: An Introduction with Applications
Statistics
ISBN:9781119256830
Author:Amos Gilat
Publisher:John Wiley & Sons Inc
Probability and Statistics for Engineering and th...
Statistics
ISBN:9781305251809
Author:Jay L. Devore
Publisher:Cengage Learning
Statistics for The Behavioral Sciences (MindTap C...
Statistics
ISBN:9781305504912
Author:Frederick J Gravetter, Larry B. Wallnau
Publisher:Cengage Learning
Elementary Statistics: Picturing the World (7th E...
Statistics
ISBN:9780134683416
Author:Ron Larson, Betsy Farber
Publisher:PEARSON
The Basic Practice of Statistics
Statistics
ISBN:9781319042578
Author:David S. Moore, William I. Notz, Michael A. Fligner
Publisher:W. H. Freeman
Introduction to the Practice of Statistics
Statistics
ISBN:9781319013387
Author:David S. Moore, George P. McCabe, Bruce A. Craig
Publisher:W. H. Freeman
Correlation Vs Regression: Difference Between them with definition & Comparison Chart; Author: Key Differences;https://www.youtube.com/watch?v=Ou2QGSJVd0U;License: Standard YouTube License, CC-BY
Correlation and Regression: Concepts with Illustrative examples; Author: LEARN & APPLY : Lean and Six Sigma;https://www.youtube.com/watch?v=xTpHD5WLuoA;License: Standard YouTube License, CC-BY