
Concept explainers
Videos
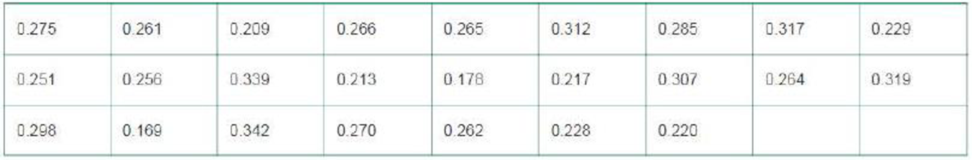
Oxygen bubble velocity in a purification process. Refer to the Chemical Engineering Research and Design (March 2013) study of a method of purifying nuclear fuel waste, Exercise 6.35 (p. 635). Recall that the process involves oxidation in molten salt and tends to produce oxygen bubbles with a rising velocity. To monitor the process, the researchers collected data on bubble velocity (measured in meters per second) for a random sample of 25 photographic bubble images. These data (simulated) are reproduced in the accompanying table. When oxygen is inserted into the molten salt at a rate (called the sparging rate) of the researchers discovered that the true
- a. Conduct a test of hypothesis to determine if the true mean bubble rising velocity for the population from which the sample is selected is μ = .338. Use α = .1 0.
- b. Based on the test results, part a, do you believe that the data in the table were generated at the sparging rate of 3.33 × 10⁻⁶? Explain.
Want to see the full answer?
Check out a sample textbook solution
Chapter 7 Solutions
Statistics For Business And Economics, Student Value Edition Plus Mystatlab With Pearson Etext -- Access Card Package (13th Edition)


- In a study examining the effect of alcohol on reaction time, Liguori and Robinson (2001) found that even moderate alcohol consumption significantly slowed response time to an emergency situation in a driving simulation. In a similar study, researchers measured reaction time 30 minutes after participants consumed one 6-ounce glass of wine. Again, they used a standardized driving simulation task for which the regular population averages μ = 400 msec. The distribution of reaction times is approximately normal with σ = 40. Assume that the researcher obtained a sample mean of M = 422 for the n = 25 participants in the study A) Are the data sufficient to conclude that the alcohol has a significant effect on reaction time? Use a two-tailed test with α = .01. B) Do the data provide evidence that the alcohol significantly increased reaction time? Use a one-tailed test with α = .01 C) Compute Cohen’s d to estimate the size of the effect.arrow_forwardIn a study examining the effect of alcohol on reaction time, Liguori and Robinson (2001) found that even moderate alcohol consumption significantly slowed response time to an emergency situation in a driving simulation. In a similar study, researchers measured reaction time 30 minutes after participants consumed one 6-ounce glass of wine. Again, they used a standardized driving simulation task for which the regular population averages µ = 400 msec. The distribution of reaction times is approximately normal with σ = 40. Assume that the researcher obtained a sample mean of M = 422 for the n = 25 participants in the study. a) Are the data sufficient to conclude that the alcohol has a significant effect on reaction time? Use a two-tailed test with α = .01 b) Do the data provide evidence that the alcohol significantly increased (slowed) reaction time? Use one-tailed test with α = .05arrow_forward(1) Conduct a hypothesis test, at the 5% level of significance, to determine whether ? is significant (2) What would be the growth of the plant if 4g of fertilizer and 7g of ater was given to it daily? (3) Carry out an F -test at the 1% significance level to determine whether the model is significantarrow_forward
- To combat antibiotic resistance, the Quality Improvement Consortium recommends a throat swab to confirm strep throat before a physician prescribes antibiotics to children under age 5. Nationally, 40 percent of children under 5 who received antibiotics did not have a throat swab. The Colorado Department of Health took a random sample of 60 children under the age of 5 who received antibiotics for throat infections and found that 18 did not have a throat swab. At α = .05, is this a statistically significant reduction over last year’s national rate of 40 percent? (a-1) Calculate the critical value. (A negative value should be indicated by a minus sign. Round your answer to 3 decimal places.) Critical value _____ (a-2) Calculate the test statistic. (A negative value should be indicated by a minus sign. Round your answer to 2 decimal places.) Test statistic _____arrow_forwardTo combat antibiotic resistance, the Quality Improvement Consortium recommends a throat swab to confirm strep throat before a physician prescribes antibiotics to children under age 5. Nationally, 40 percent of children under 5 who received antibiotics did not have a throat swab. The Colorado Department of Health took a random sample of 100 children under the age of 5 who received antibiotics for throat infections and found that 30 did not have a throat swab. At α = .05, is this a statistically significant reduction over last year’s national rate of 40 percent? (a-1) Choose the correct null and alternative hypotheses. H0: π ≥ .40 vs. H1: π < .40 H0: π ≤ .40 vs. H1: π > .40 H0: π = .40 vs. H1: π ≠ .40 (a-2) Calculate the critical value. (A negative value should be indicated by a minus sign. Round your answer to 3 decimal places.) Critical value (a-3) Calculate the test statistic. (A negative value should be indicated by a minus sign. Round your…arrow_forwardResearchers interested in lead exposure due to car exhaust sampled the blood of 52 police officers subjected to constant inhalation of automobile exhaust fumes while working traffic enforcement in a primarily urban environment. The blood samples of these officers had an average lead concentration of 124.32 µg/l and an SD of 37.74 µg/l; a previous study of individuals from a nearby suburb, with no history of exposure, found an average blood level concentration of 35 µg/l. Write down the hypotheses that would be appropriate for testing if the police officers appear to have been exposed to a higher concentration of lead. Explicitly state and check all conditions necessary for inference on these data. Test the hypothesis that the downtown police officers have a higher lead exposure than the group in the previous study. Interpret your results in context. Based on your preceding result, without performing a calculation, would a 99% confidence interval for the average blood concentration…arrow_forward
- In a study examining the effect of alcohol on reaction time, Liguori and Robinson (2001) found that evenmoderate alcohol consumption significantly slowed response time to an emergency situation in a drivingsimulation. In a similar study, researchers measured reaction time 30 minutes after participants consumed one6-ounce glass of wine. Again, they used a standardized driving simulation task for which the regular populationaverages μ = 400 msec. The distribution of reaction times is approximately normal with σ = 40. Assume that theresearcher obtained a sample mean of M = 422 for the n = 25 participants in the study.a. Are the data sufficient to conclude that the alcohol has a significant effect on reaction time? Use a two-tailed testwith α = .01.arrow_forwardA study on the oxygen consumption rate (OCR) of sea cucumbers involved a random sample of size 12 at 15oC and a second random sample of size 5 kept at 18oC. To test the hypothesis that this range of temperature had no effect on the OCR, what is the degrees of freedom for a two-sample t-test?arrow_forwardLactation promotes a temporary loss of bone mass to provide adequate amounts of calcium for milk production. The paper “Bone Mass Is Recovered from Lactation to Postweaning in Adolescent Mothers with Low Calcium Intakes” (Amer. J. of Clinical Nutr., 2004: 1322–1326) gave the following data on total body bone mineral content (TBBMC) (g) for a sample both during lactation (L) and in the postweaning period (P). SubjectL 1928 2549 2825 1924 1628 2175 2114 2621 1843 2541P 2126 2885 2895 1942 1750 2184 2164 2626 2006 2627 Does the data suggest that true average total body bone mineral content during postweaning exceeds that during lactation by more than 25 g? State and test the appropriate hypotheses using a significance level of .05.arrow_forward
- The median pH level of the rain in a certain county, was 4.90. A biologist obtains a random sample of 19 rain dates and obtains the following data. Test the hypothesis that the median pH level has decreased from 4.90 at the alpha= 0.05 level of significance.arrow_forwardThree samples of each of three types of PVC pipe of equal wall thickness are tested to failure under three temperature conditions, yielding the results shown below. Research questions: Is mean burst strength affected by temperature and/or by pipe type? Is there a “best” brand of PVC pipe? Burst Strength of PVC Pipes (psi) Temperature PVC1 PVC2 PVC3 Hot (70º C) 247 299 239 277 287 262 283 275 279 Warm (40º C) 325 341 297 322 319 315 296 335 304 Cool (10º C) 358 375 327 366 352 334 338 359 340 Click here for the Excel Data File (a-1) Choose the correct row-effect hypotheses. a. H0: A1 ≠ A2 ≠ A3 ≠ 0 ⇐⇐ Temperature means differ H1: All the Aj are equal to zero ⇐⇐ Temperature means are the same b. H0: A1 = A2 = A3 = 0 ⇐⇐ Temperature means are the same H1: Not all the Aj are equal to zero ⇐⇐ Temperature means differ a b (a-2) Choose the correct column-effect hypotheses. a. H0: B1 ≠ B2 ≠ B3 ≠ 0 ⇐⇐…arrow_forwardThe National Transportation Safety Board wants to look at the safety of three different sizes of cars. Using the data below, determine the whether the mean pressure applied to the driver`s head during a crash is equal for each type of car at alpha = 0.01 Compact cars Midsize cars Full-size Cars 643 469 484 655 427 456 702 525 402 a) Ho: Ha : b) Decision c) Conclusionarrow_forward
 MATLAB: An Introduction with ApplicationsStatisticsISBN:9781119256830Author:Amos GilatPublisher:John Wiley & Sons Inc
 Probability and Statistics for Engineering and th...StatisticsISBN:9781305251809Author:Jay L. DevorePublisher:Cengage Learning
 Statistics for The Behavioral Sciences (MindTap C...StatisticsISBN:9781305504912Author:Frederick J Gravetter, Larry B. WallnauPublisher:Cengage Learning
 Elementary Statistics: Picturing the World (7th E...StatisticsISBN:9780134683416Author:Ron Larson, Betsy FarberPublisher:PEARSON
 The Basic Practice of StatisticsStatisticsISBN:9781319042578Author:David S. Moore, William I. Notz, Michael A. FlignerPublisher:W. H. Freeman
 Introduction to the Practice of StatisticsStatisticsISBN:9781319013387Author:David S. Moore, George P. McCabe, Bruce A. CraigPublisher:W. H. Freeman