
Concept explainers
Videos
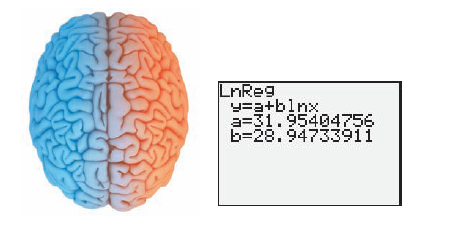
The graphing calculator screen displays the percentage of an adult size brain, y for a child at age x, where
Use this information to solve Exercises 35-36.
a. Explain why a logarithmic function was used to model the data.
b. Use the graphing calculator screen to express the model in function notation, with numbers rounded to the nearest whole number.
c. According to the model in part (b), what percentage of an adult size brain does a child have at age 10? Use a calculator with an
key and round to the nearest whole percent. Does this overestimate or underestimate the percent displayed by the table? By how much?
Want to see the full answer?
Check out a sample textbook solution
Chapter 7 Solutions
EBK THINKING MATHEMATICALLY


 Big Ideas Math A Bridge To Success Algebra 1: Stu...AlgebraISBN:9781680331141Author:HOUGHTON MIFFLIN HARCOURTPublisher:Houghton Mifflin Harcourt
 Algebra & Trigonometry with Analytic GeometryAlgebraISBN:9781133382119Author:SwokowskiPublisher:Cengage
 Glencoe Algebra 1, Student Edition, 9780079039897...AlgebraISBN:9780079039897Author:CarterPublisher:McGraw Hill
 Trigonometry (MindTap Course List)TrigonometryISBN:9781337278461Author:Ron LarsonPublisher:Cengage Learning
 College Algebra (MindTap Course List)AlgebraISBN:9781305652231Author:R. David Gustafson, Jeff HughesPublisher:Cengage Learning