Concept explainers
Videos
Temperature data Hourly temperature data for Boulder, Colorado. San Francisco, California. Nantucket, Massachusetts, and Duluth, Minnesota, over a 12 hr period on the same day of January are shown in the figure. Assume that these data are taken from a continuous temperature function T(t). The average temperature over the 12-hr period is
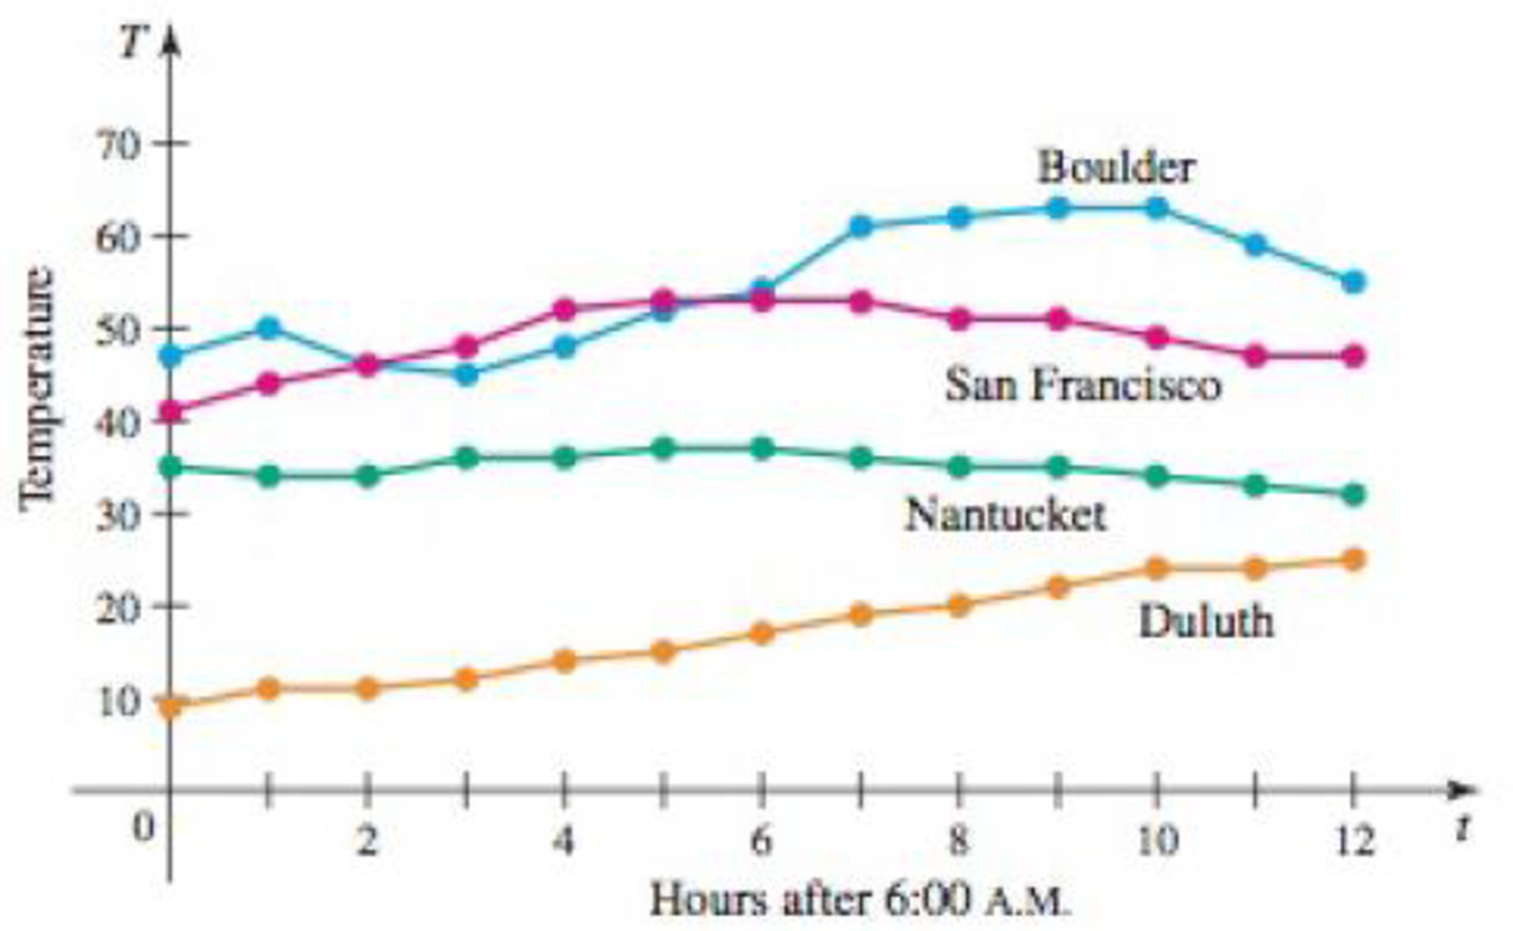
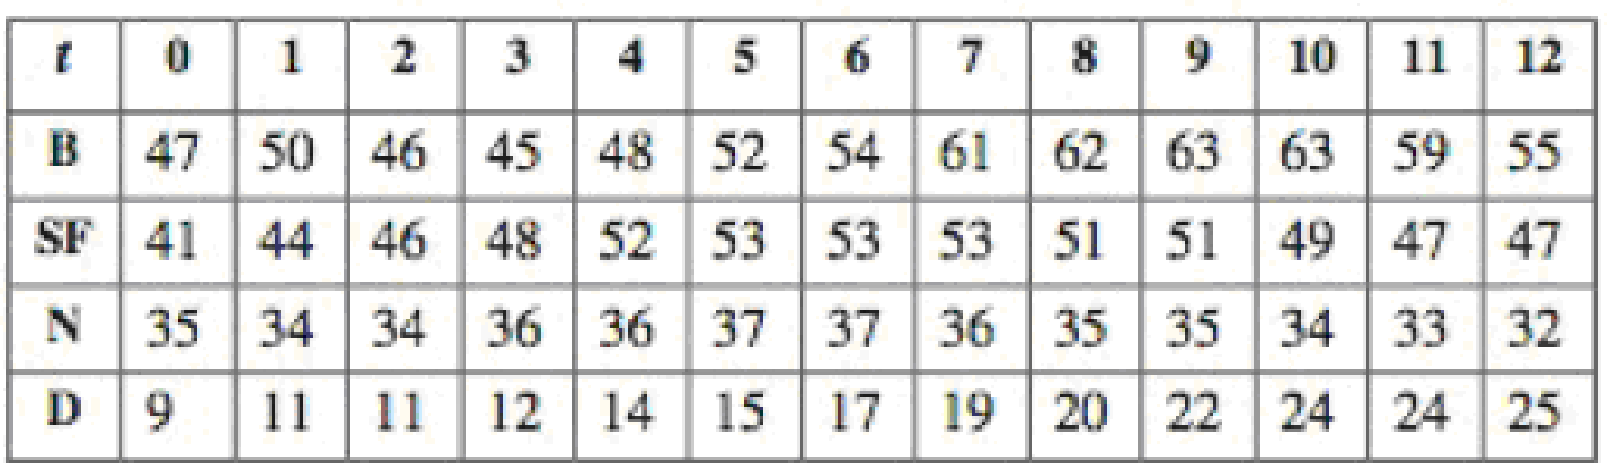
28. Find an accurate approximation to the average temperature over the 12-hr period for San Francisco. State your method.
Want to see the full answer?
Check out a sample textbook solution
Chapter 7 Solutions
Calculus: Early Transcendentals, Books a la Carte Plus MyLab Math/MyLab Statistics Student Access Kit (2nd Edition)
Additional Math Textbook Solutions
Thomas' Calculus: Early Transcendentals (14th Edition)
University Calculus: Early Transcendentals (4th Edition)
Calculus, Single Variable: Early Transcendentals (3rd Edition)
Calculus & Its Applications (14th Edition)
Calculus and Its Applications (11th Edition)


- Decay of Litter Litter such as leaves falls to the forest floor, where the action of insects and bacteria initiates the decay process. Let A be the amount of litter present, in grams per square meter, as a function of time t in years. If the litter falls at a constant rate of L grams per square meter per year, and if it decays at a constant proportional rate of k per year, then the limiting value of A is R=L/k. For this exercise and the next, we suppose that at time t=0, the forest floor is clear of litter. a. If D is the difference between the limiting value and A, so that D=RA, then D is an exponential function of time. Find the initial value of D in terms of R. b. The yearly decay factor for D is ek. Find a formula for D in term of R and k. Reminder:(ab)c=abc. c. Explain why A=RRekt.arrow_forwardHollings Functional Response Curve The total number P of prey taken by a predator depends on the availability of prey. C.S. Holling proposed a function of the form P=cn(1+dn) to model the number of prey taken in certain situations. Here n is the density of prey available, and c and d are constants that depend on the organisms involved as well as on other environmental features. Holling took data gathered earlier by T. Burnett on the number of sawfly cocoons found by a small wasp parasite at given host density. In one such experiment conducted, Holling found the relationship p=21.96n1+2.41n, Where P is the number of cocoons parasitized and n is the density of cocoons available measured as number per square inch. a Draw a graph of p versus n. Include values of n up to 2 cocoons per square inch. b What density of cocoons will ensure that the wasp will find and parasitize 6 of them? c There is a limit to the number of cocoons that the wasp is able to parasitize no matter how readily available the prey may be. What is this upper limit?arrow_forwardaThe average rate of change of a function f between x=a and x=b is the slope of the ___________ line between (a,f(a)) and (b,f(b)).arrow_forward
 Trigonometry (MindTap Course List)TrigonometryISBN:9781337278461Author:Ron LarsonPublisher:Cengage Learning
 Functions and Change: A Modeling Approach to Coll...AlgebraISBN:9781337111348Author:Bruce Crauder, Benny Evans, Alan NoellPublisher:Cengage Learning
 Algebra & Trigonometry with Analytic GeometryAlgebraISBN:9781133382119Author:SwokowskiPublisher:Cengage
 Elementary Linear Algebra (MindTap Course List)AlgebraISBN:9781305658004Author:Ron LarsonPublisher:Cengage Learning
 Algebra and Trigonometry (MindTap Course List)AlgebraISBN:9781305071742Author:James Stewart, Lothar Redlin, Saleem WatsonPublisher:Cengage Learning