Concept explainers
Videos
U.S. oil produced and imported The figure shows the rate at which U.S. oil was produced and imported between 1920 and 2005 in units of millions of barrels per day. The total amount of oil produced or imported is given by the area of the region under the corresponding curve. Be careful with units because both days and years are used in this data set.
- a. Use numerical
integration to estimate the amount of U.S. oil produced between 1940 and 2000. Use the method of your choice and experiment with values of n. - b. Use numerical integration to estimate the amount of oil imported between 1940 and 2000. Use the method of your choice and experiment with values of n.
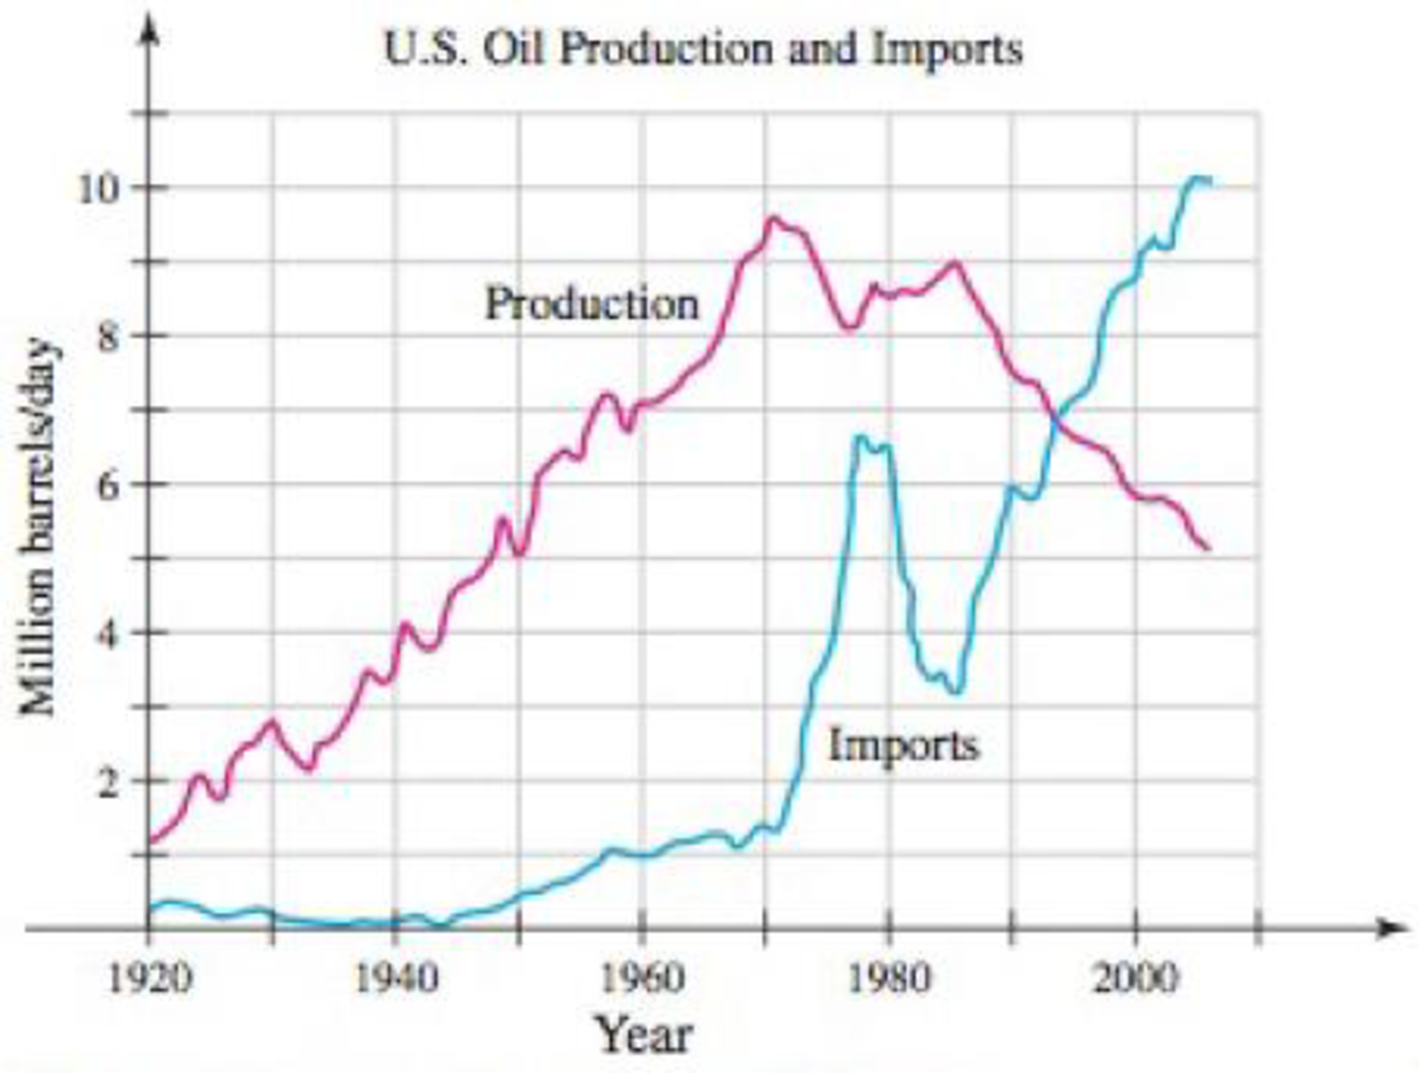
(Source: U.S. Energy Information Administration)
Want to see the full answer?
Check out a sample textbook solution
Chapter 7 Solutions
Calculus: Early Transcendentals, Books a la Carte Plus MyLab Math/MyLab Statistics Student Access Kit (2nd Edition)
Additional Math Textbook Solutions
Glencoe Math Accelerated, Student Edition
University Calculus: Early Transcendentals (3rd Edition)
Precalculus: Concepts Through Functions, A Unit Circle Approach to Trigonometry (4th Edition)
Precalculus
Thomas' Calculus: Early Transcendentals (14th Edition)
Calculus, Single Variable: Early Transcendentals (3rd Edition)


 Algebra & Trigonometry with Analytic GeometryAlgebraISBN:9781133382119Author:SwokowskiPublisher:Cengage
 Glencoe Algebra 1, Student Edition, 9780079039897...AlgebraISBN:9780079039897Author:CarterPublisher:McGraw Hill
 Algebra and Trigonometry (MindTap Course List)AlgebraISBN:9781305071742Author:James Stewart, Lothar Redlin, Saleem WatsonPublisher:Cengage Learning