Concept explainers
Videos
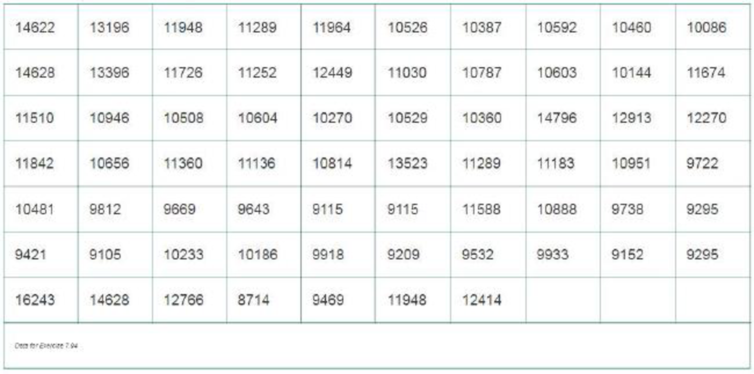
Cooling method for gas turbines. During periods of high electricity demand, especially during the hot summer months, the power output from a gas turbine engine can drop dramatically. One way to counter this drop in power is by cooling the inlet air to the gas turbine. An increasingly popular cooling method uses high-pressure inlet fogging. The performance of a sample of 67 gas turbines augmented with high-pressure inlet fogging was investigated in the Journal of Engineering for Gas Turbines and Power (January 2005). One measure of performance is heat rate (kilojoules per kilowatt per hour). Heat rates for the 67 gas turbines are listed in the table below. Suppose that standard gas turbines have heat rates with a standard deviation of 1,500 kJ/kWh. Is there sufficient evidence to indicate that the heat rates of the augmented gas turbine engine are more variable than the heat rates of the standard gas turbine engine? Test using α = .05.
Want to see the full answer?
Check out a sample textbook solution
Chapter 7 Solutions
Statistics For Business And Economics Plus Mystatlab With Pearson Etext -- Access Card Package (13th Edition)


- Population Genetics In the study of population genetics, an important measure of inbreeding is the proportion of homozygous genotypesthat is, instances in which the two alleles carried at a particular site on an individuals chromosomes are both the same. For population in which blood-related individual mate, them is a higher than expected frequency of homozygous individuals. Examples of such populations include endangered or rare species, selectively bred breeds, and isolated populations. in general. the frequency of homozygous children from mating of blood-related parents is greater than that for children from unrelated parents Measured over a large number of generations, the proportion of heterozygous genotypesthat is, nonhomozygous genotypeschanges by a constant factor 1 from generation to generation. The factor 1 is a number between 0 and 1. If 1=0.75, for example then the proportion of heterozygous individuals in the population decreases by 25 in each generation In this case, after 10 generations, the proportion of heterozygous individuals in the population decreases by 94.37, since 0.7510=0.0563, or 5.63. In other words, 94.37 of the population is homozygous. For specific types of matings, the proportion of heterozygous genotypes can be related to that of previous generations and is found from an equation. For mating between siblings 1 can be determined as the largest value of for which 2=12+14. This equation comes from carefully accounting for the genotypes for the present generation the 2 term in terms of those previous two generations represented by for the parents generation and by the constant term of the grandparents generation. a Find both solutions to the quadratic equation above and identify which is 1 use a horizontal span of 1 to 1 in this exercise and the following exercise. b After 5 generations, what proportion of the population will be homozygous? c After 20 generations, what proportion of the population will be homozygous?arrow_forwardUrban Travel Times Population of cities and driving times are related, as shown in the accompanying table, which shows the 1960 population N, in thousands, for several cities, together with the average time T, in minutes, sent by residents driving to work. City Population N Driving time T Los Angeles 6489 16.8 Pittsburgh 1804 12.6 Washington 1808 14.3 Hutchinson 38 6.1 Nashville 347 10.8 Tallahassee 48 7.3 An analysis of these data, along with data from 17 other cities in the United States and Canada, led to a power model of average driving time as a function of population. a Construct a power model of driving time in minutes as a function of population measured in thousands b Is average driving time in Pittsburgh more or less than would be expected from its population? c If you wish to move to a smaller city to reduce your average driving time to work by 25, how much smaller should the city be?arrow_forwardA product developer is investigating the tensile strength of a new synthetic fiber that will be used to make cloth for men’s shirts. Strength is usually affected by the percentage of cotton used in the blend of materials for the fiber. The engineer conducts a completely randomized experiment with five levels of cotton content and replicated the experiment five times. The data are shown in the following table. Cotton Weight Percentage Observations 15 7 7 15 11 9 20 12 17 12 18 18 25 14 19 19 18 18 30 19 25 22 19 23 35 7 10 11 15 11 (a) Is there evidence to support the claim that cotton content affects the mean tensile strength? Use a = 0.05 conduct a hypothesis testing. (b) Conduct pairwise comparison using Fisher’s LSD approach. What conclusions can you draw? Redo it using Tukey method, what conclusions can you draw now?arrow_forward
- A student decides to spin a dime and determine the proportion of times it lands on heads. The student spins the dime 25 times and records that it lands on heads 17 times. Let p = the true proportion of times the dime would land on heads when spun. Under the assumption that the true proportion is 0.5, 100 simulated proportions for samples of size 25 is shown in the dotplot. Using the dotplot, is there evidence that the proportion of times a spun dime lands on heads is greater than 0.5? A) Yes, a proportion of 0.68 proves that the true proportion of heads is greater than 0.5. B) Yes, a proportion of 0.68 only occurred once out of 100 simulated proportions; therefore, there is sufficient evidence that the true proportion of heads is greater than 0.5. C) No, a proportion of 0.68 is only 0.18 more than 0.5; therefore, there is insufficient evidence that the true proportion of heads is greater than 0.5. D) No, a proportion of 0.68 or more occurred 7 times out of 100 simulated…arrow_forward2.Researchers studied selenium levels in beef raised in a low selenium region of the United States. The goal of the study was to compare selenium levels in the region-raised beef to selenium levels in cooked venison, squirrel, and beef from other regions of the United States. The data in the Excel file (se_level.xlsx or se_level.txt) are the selenium levels calculated on a dry weight basis in mg=100 g for a sample of 53 region-raised cattle 11.23 29.63 20.42 10.12 39.91 32.66 38.38 36.21 16.39 27.44 17.29 56.20 28.94 20.11 25.35 21.77 31.62 32.63 30.31 46.16 56.61 24.47 29.39 40.71 18.52 27.80 19.49 15.82 27.74 22.35 34.78 35.09 32.60 37.03 27.00 44.20 13.09 33.03 9.69 32.45 37.38 34.91 27.99 22.36 22.68 26.52 46.01 38.04 30.88 30.04 25.91 18.54 25.51 Please answer the following questions: Use these data to construct: A…arrow_forwardAre yields for organic farming different from conventional farming yields? Independent random samples from method A (organic farming) and method B (conventional farming) gave the following information about yield of lima beans (in tons/acre). Method A 1.85 1.27 1.15 1.23 1.53 1.51 1.71 1.87 1.37 1.99 2.33 Method B 1.13 1.29 1.77 1.61 2.01 1.43 1.93 1.35 1.63 1.89 1.83 2.17 Use a 5% level of significance to test the hypothesis that there is no difference between the yield distributions. (a) What is the level of significance? (b) Compute the sample test statistic. (Use 2 decimal places.) (c) Find the P-value of the sample test statistic (Use 4 decimal places.)arrow_forward
- In its January 25, 2012, issue, the Journal of the American Medical Association reported on the effects of overconsumption of low, normal, and high protein diets on weight gain, energy expenditure, and body composition. Researchers conducted a single blind, randomized controlled trial of 25 U.S. adults. The subjects were healthy, weight-stable, male and female volunteers, aged 18 to 35 years. All subjects consumed a weight-stabilizing diet for 13 to 25 days. Afterwards, the researchers randomly assigned participants to diets containing various percentages of energy from protein: 5% (low protein), 15% (normal protein), or 25% (high protein). The subjects were not aware of the specific protein level diet to which they were assigned. On these diets the researchers overfed the participants during the last 8 weeks of their 10 to 12 week stay in the inpatient metabolic unit. The goal was to investigate the effect of overconsumption of protein on weight gain, energy expenditure, and body…arrow_forwardAre yields for organic farming different from conventional farming yields? Independent random samples from method A (organic farming) and method B (conventional farming) gave the following information about yield of lima beans (in tons/acre). Method A 1.39 1.87 1.29 1.53 1.47 1.79 1.77 1.83 1.61 2.15 2.33 Method B 1.45 2.11 1.85 2.07 1.89 2.03 1.95 1.41 1.73 1.27 1.93 1.13 Use a 5% level of significance to test the hypothesis that there is no difference between the yield distributions. (a) What is the level of significance? State the null and alternate hypotheses. Ho: Distributions are the same. H1: Distributions are the same.Ho: Distributions are the same. H1: Distributions are different. Ho: Distributions are different. H1: Distributions are different.Ho: Distributions are different. H1: Distributions are the same. (b) Compute the sample test statistic. (Use 2 decimal places.) What sampling distribution will you use? uniformStudent's t normalchi-square…arrow_forward10.50 Recess and Wasted Food. E. Bergman et al. conducted a study to determine, among other things, the impact that scheduling recess before or after the lunch period has on wasted food for students in grades three through five. Results were published in the online article “The Relationship of Meal and Recess Schedules to Plate Waste in Elementary Schools” (Journal of Child Nutrition and Management, Vol. 28, Issue 2). Summary statistics for the amount of food wasted, in grams, by randomly selected students are presented in the following table. Lunch before recess Lunch after recess ¯ x1 = 223.1 ¯ x2 = 156.6 s1 = 122.9 s2 = 108.1 n1 = 889 n2 = 1119 At the 1% significance level, do the data provide sufficient evidence to conclude that, in grades three through five, the mean amount of food wasted for lunches before recess exceeds that for lunches after recess?arrow_forward
 Functions and Change: A Modeling Approach to Coll...AlgebraISBN:9781337111348Author:Bruce Crauder, Benny Evans, Alan NoellPublisher:Cengage Learning
 Glencoe Algebra 1, Student Edition, 9780079039897...AlgebraISBN:9780079039897Author:CarterPublisher:McGraw Hill