
BIOCHEMISTRY BOOKS ALC&MOD MST/ET PKG
1st Edition
ISBN: 9780134172507
Author: APPLING
Publisher: Pearson Education
expand_more
expand_more
format_list_bulleted
Concept explainers
Videos
Textbook Question
Chapter 8, Problem 13P
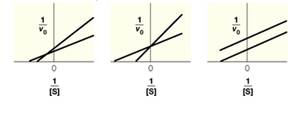
The accompanying figure shows three Lineweaver—Burk plots for enzyme reactions that have been carried out the presence, or absence, of an inhibitor. Indicate what type of inhibition is predicted based on each Lineweaver—Burk plot. For each plot indicate which line corresponds to the reaction without inhibitor and which line corresponds to the reaction with inhibitor present.
Expert Solution & Answer

Trending nowThis is a popular solution!

Students have asked these similar questions
The accompanying figure shows three Lineweaver–Burk plots for enzymereactions that have been carried out in the presence, or absence, of aninhibitor. Indicate what type of inhibition is predicted based on eachLineweaver–Burk plot. For each plot indicate which line corresponds to thereaction without inhibitor and which line corresponds to the reaction withinhibitor present.
By using Excel or GoogleSheets, graph the Lineweaver-Burk plots for the behavior of
an enzyme for which the following experimental data are available. What are the Km and
V
values for the inhibited and uninhibited reactions? Is the inhibitor competitive or
max
noncompetitive?
[S]
(mM)
V, No Inhibitor
(mmol min-')
V, Inhibitor Present
(mmol min-')
1× 10⁻⁴
5 × 10⁻⁴
1.5 × 10⁻³
2.5 × 10⁻³
5 × 10⁻³
0.026
0.092
0.136
0.150
0.010
0.040
0.086
0.120
0.165
0.142
Activate
The Lineweaver-Burk plot, which illustrates the reciprocal of the reaction rate (1/v) versus the reciprocal of the substrate concentration (1/[S]), is a graphical
representation of enzyme kinetics. This plot is typically used to determine the maximum rate, Vmax, and the Michaelis constant, Km, which can be gleaned from
the intercepts and slope. Identify each intercept and the slope in terms of the constants Vmax and Km. What term is represented by C?
Linewegver-Burk Pt
1/Vmax
O A.
В.
-1/Km
Km/Vmax
C.
Chapter 8 Solutions
BIOCHEMISTRY BOOKS ALC&MOD MST/ET PKG
Ch. 8 - Prob. 1PCh. 8 - The enzyme urease catalyzes the hydrolysis of urea...Ch. 8 - An enzyme contains an active site aspartic acid...Ch. 8 - The folding and unfolding rate constants for a...Ch. 8 - In some reactions, in which a protein molecule is...Ch. 8 - Would you expect an “enzyme” designed to bind to...Ch. 8 - The initial rate for an enzyme-catalyzed reaction...Ch. 8 - a. If the total enzyme concentration in Problem 7...Ch. 8 - Prob. 9PCh. 8 - Prob. 10P
Ch. 8 - The following data describe the catalysis of...Ch. 8 - At 37 oC, the serine protease subtilisin has kcat...Ch. 8 - The accompanying figure shows three...Ch. 8 - The steady-state kinetics of an enzyme are studied...Ch. 8 - The same enzyme as in Problem 14 is studied in the...Ch. 8 - Enalapril is an anti-hypertension “pro-drug"...Ch. 8 - Initial rate data for an enzyme that obeys...Ch. 8 - Prob. 18PCh. 8 - Suggest the effects of each of the following...Ch. 8 - The inhibitory effect of an uncompetitive...Ch. 8 - Prob. 21P
Knowledge Booster


Learn more about
Need a deep-dive on the concept behind this application? Look no further. Learn more about this topic, biochemistry and related others by exploring similar questions and additional content below.Similar questions
- An enzymes catalyzed reaction is studied in the presence and absence of an inhibitor. The following data was obtained in the image provided. Plot 1/[S] as abscissa and 1/V as ordinate for both catalyzed reactions and reaction with inhibitor. Use the same graph for both plots Calculate the following: Km of enzyme in the reaction without inhibitor Km' of the enzyme in the reation with inhibitor Vmax of the uninhibited reaction Vmax of the inhibited reaction What kind of inhibitor was added to the enzyme catalyzed reaction? Explain your answer in terms of changes in Km and Vmax.arrow_forwardAn enzymes catalyzed reaction is studied in the presence and absence of an inhibitor. The following data was obtained in the image provided. Plot 1/[S] as abscissa and 1/V as ordinate for both catalyzed reactions and reaction with inhibitor. Use the same graph for both plots Michaelis–Menten kinetics Lineweaver–Burk plot Calculate the following: Km of enzyme in the reaction without inhibitor Km' of the enzyme in the reation with inhibitor Vmax of the uninhibited reaction Vmax of the inhibited reaction What kind of inhibitor was added to the enzyme catalyzed reaction? Explain your answer in terms of changes in Km and Vmax.arrow_forwardAn enzyme-catalyzed reaction has a KM of 20.0 mmol L-1 and Vmax of 17.0 pmol s-1. When a mixed inhibitor is added, the apparent KM is 50.0 mmol L-1 and the apparent Vmax is 5.20 pmol s-1. Calculate α.arrow_forward
- The following data was obtained during kinetic analysis of an enzyme with and without an inhibitor. Substrate concentration (mM) Reaction rate without inhibitor (µM/s) Reaction rate with inhibitor (µM/s) 10 28 12 20 50 23 40 83 42 60 107 58 100 139 83 200 179 125 300 197 150 400 209 167 560 227 197 How do you calculate the KM for the enzyme in the absence of an inhibitor. And how do you calculate kcat with the given enzymatic concentration of 5 µM.arrow_forwardDraw a hypothetical Michaelis-Menten plot for an enzyme reaction (i) without and (ii) with a pure noncompetitive inhibitor. Label Vax and Km on plotarrow_forwardThe Lineweaver-Burke plot was originally developed in order to "linearize" the data obtained from enzyme kinetics experiments, in order to facilitate the determination of kinetic parameters. Why is it not considered to be an accurate method for this purpose? It is very difficult to draw a straight line on a computer. It is very difficult to calculate the variables required for the "x" and "y" axis. It is more accurate to use the standard "V versus [S]" plot to determine Vmax and KM- The plot weights the least accurate data points the most heavily. It is no longer considered to be acceptable to extrapolate from known data.arrow_forward
- (b) You are investigating the effects of several agents on the activity of alcohol dehydrogenase. The enzyme activity data are shown in the table below. Construct a [substrate] vs. activity plot and a double-reciprocal plot for this enzyme. Be sure to label all axes. Determine the Vmax and KM for AD from the graphs in each type of plot. AD activity (nM/min) AD activity + agent A (nM/min) AD activity + agent B (nM/min) [Alcohol] (nM) 0.1 14 2 0.5 50 7 8. 1.0 65 10 30 2.0 72 12 45 4.0 80 14 62 8.0 85 15 75 32.0 90 16 90arrow_forwardGiven the following data in enzyme-catalyzed reaction, what are the Vm, Km of with DEDS (presence of inhibitor) and without DEDS ( absence of inhibitor) and its type of inhibition.arrow_forwardA с Wan WWW GHEDE MAK am2 Increasing CE a-1 (no inhibitor) Slope #KY... ...." 7-15 7 a>c²=1 [no inhibitori Slope R 101 9-19 aver-Burk plots in this figure represent the activities of enzymes in the 4-5 n. 155 B D MIN -a'/KM 0.8- 1/V >~- -1/K 0 01 m(app) d'Nmax a=2 a=1.5 1[S] per mM inhibitor a=10 Slope Karrow_forward
- Under the following conditions, fill in the blanks. Then, describe why this inhibitor is the type of inhibitor you identified it as. If you were to add 5nM of a reversible inhibitor, the Km for the measured enzyme catalyzed reaction would ______ (Increase, Decrease, Stay the same) to ______µM (choose appropriate value) and Vmax would _______ (Increase, Decrease, Stay the same) to ______µMs-1. So, this inhibitor is a ______ (Competitive, Uncompetitive, Mixed) inhibitor. Conditions: kcat = 130 s^-1 Vo = 3.0 μMs-1 S = 10 μM Et = 0.09 µMarrow_forwardExplain why each of the following data sets from a Lineweaver–Burk plot are not individually ideal for determining KM for an enzymecatalyzed reaction that follows Michaelis–Menten kinetics.arrow_forwardGiven the following data in enzyme-catalyzed reaction, what is the Vm, Km and type of inhibition of Experiment A?arrow_forward
arrow_back_ios
SEE MORE QUESTIONS
arrow_forward_ios
Recommended textbooks for you
 BiochemistryBiochemistryISBN:9781319114671Author:Lubert Stryer, Jeremy M. Berg, John L. Tymoczko, Gregory J. Gatto Jr.Publisher:W. H. Freeman
 Lehninger Principles of BiochemistryBiochemistryISBN:9781464126116Author:David L. Nelson, Michael M. CoxPublisher:W. H. Freeman
 Fundamentals of Biochemistry: Life at the Molecul...BiochemistryISBN:9781118918401Author:Donald Voet, Judith G. Voet, Charlotte W. PrattPublisher:WILEY
 BiochemistryBiochemistryISBN:9781305961135Author:Mary K. Campbell, Shawn O. Farrell, Owen M. McDougalPublisher:Cengage Learning
 BiochemistryBiochemistryISBN:9781305577206Author:Reginald H. Garrett, Charles M. GrishamPublisher:Cengage Learning
 Fundamentals of General, Organic, and Biological ...BiochemistryISBN:9780134015187Author:John E. McMurry, David S. Ballantine, Carl A. Hoeger, Virginia E. PetersonPublisher:PEARSON
Biochemistry
Biochemistry
ISBN:9781319114671
Author:Lubert Stryer, Jeremy M. Berg, John L. Tymoczko, Gregory J. Gatto Jr.
Publisher:W. H. Freeman
Lehninger Principles of Biochemistry
Biochemistry
ISBN:9781464126116
Author:David L. Nelson, Michael M. Cox
Publisher:W. H. Freeman
Fundamentals of Biochemistry: Life at the Molecul...
Biochemistry
ISBN:9781118918401
Author:Donald Voet, Judith G. Voet, Charlotte W. Pratt
Publisher:WILEY
Biochemistry
Biochemistry
ISBN:9781305961135
Author:Mary K. Campbell, Shawn O. Farrell, Owen M. McDougal
Publisher:Cengage Learning
Biochemistry
Biochemistry
ISBN:9781305577206
Author:Reginald H. Garrett, Charles M. Grisham
Publisher:Cengage Learning
Fundamentals of General, Organic, and Biological ...
Biochemistry
ISBN:9780134015187
Author:John E. McMurry, David S. Ballantine, Carl A. Hoeger, Virginia E. Peterson
Publisher:PEARSON
Anaerobic Respiration; Author: Bozeman Science;https://www.youtube.com/watch?v=cDC29iBxb3w;License: Standard YouTube License, CC-BY