STATISTICS FOR ENGINEERS+SCI.-ACCESS
4th Edition
ISBN: 9781259998584
Author: Navidi
Publisher: MCG
expand_more
expand_more
format_list_bulleted
Videos
Textbook Question
Chapter 8, Problem 15SE
The article “Measurements of the Thermal Conductivity and Thermal Diffusivity of Polymer Melts with the Short-Hot-Wire Method” (X. Zhang, W. Hendro, et al., International Journal of Thermophysics, 2002:1077–1090) reports measurements of the thermal conductivity (in W · m–1 · K–1) and diffusivity of several polymers at several temperatures (in 1000 C). The following table presents results for the thermal conductivity of polycarbonate.
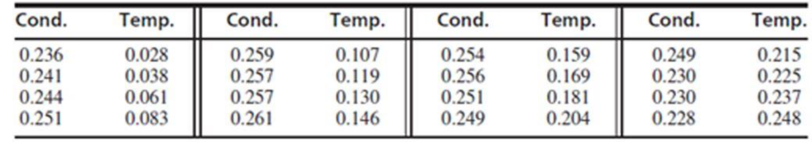
- a. Denoting conductivity by y and temperature by x. fit the linear model
- b. Fit the quadratic model
- c. Fit the cubic model
- d. Fit the quartic model
- e. Which of the models in parts (a) through (d) is the most appropriate? Explain.
- f. Using the most appropriate model, estimate the conductivity at a temperature of 120°C.
Expert Solution & Answer
Want to see the full answer?
Check out a sample textbook solution
Students have asked these similar questions
In the article “Influence of Crack Width on Shear Behaviour of SIFCON” (C. Fritz and H. Reinhardt, High Performance Fiber Reinforced Cement Composites: Proceedings of the International RILEM/ACI Workshop, 1992), the maximum shear stress τ of a cracked concrete member is given to be τ = τ0(1 − kw), where τ0 is the maximum shear stress for a crack width of zero, w is the crack width in mm, and k is a constant estimated from experimental data. Assume k = 0.29 ± 0.05 mm−1. Given that τ0 = 50 MPa and w = 1.0 mm, both with negligible uncertainty, estimate τ and find the uncertainty in the estimate.
The article “n-Nonane Hydroconversion on Ni and Pt Containing HMFI, HMOR and HBEA” (G. Kinger and H. Vinek, Applied Catalysis A: General, 2002:139–149) presents hydroconversion rates (in μmol/g · s) of n-nonane over both HMFI and HBEA catalysts. The results are as follows: HMFI: 0.43 0.93 1.91 2.56 3.72 6.19 11.00 HBEA: 0.73 1.12 1.24 2.93 Can you conclude that the mean rate differs between the two catalysts?
The article “Abyssal Peridotites > 3800 Ma from Southern West Greenland: Field Relationships, Petrography, Geochronology, Whole-Rock and Mineral Chemistry of Dunite and Harzburgite Inclusions in the Itsaq Gneiss Complex” (C. Friend, V. Bennett, and A. Nutman, Contrib Mineral Petrol, 2002:71–92) describes the chemical compositions of certain minerals in the early Archaean mantle. For a certain type of olivine assembly, the silicon dioxide (SiO2) content (in weight percent) in a randomly chosen rock has mean 40.25 and standard deviation 0.36. Find the mean and standard deviation of the sample mean SiO2 content in a random sample of 10 rocks. How many rocks must be sampled so that the standard deviation of the sample mean SiO2 content is 0.05?
Chapter 8 Solutions
STATISTICS FOR ENGINEERS+SCI.-ACCESS
Ch. 8.1 - In an experiment to determine the factors...Ch. 8.1 - Prob. 2ECh. 8.1 - Prob. 3ECh. 8.1 - The article Application of Analysis of Variance to...Ch. 8.1 - Prob. 5ECh. 8.1 - Prob. 6ECh. 8.1 - Prob. 7ECh. 8.1 - Refer to Exercise 7. a. Find a 95% confidence...Ch. 8.1 - In a study of the lung function of children, the...Ch. 8.1 - Prob. 10E
Ch. 8.1 - Prob. 11ECh. 8.1 - The following MINITAB output is for a multiple...Ch. 8.1 - Prob. 13ECh. 8.1 - Prob. 14ECh. 8.1 - Prob. 15ECh. 8.1 - The following data were collected in an experiment...Ch. 8.1 - The November 24, 2001, issue of The Economist...Ch. 8.1 - The article Multiple Linear Regression for Lake...Ch. 8.1 - Prob. 19ECh. 8.2 - In an experiment to determine factors related to...Ch. 8.2 - In a laboratory test of a new engine design, the...Ch. 8.2 - In a laboratory test of a new engine design, the...Ch. 8.2 - The article Influence of Freezing Temperature on...Ch. 8.2 - The article Influence of Freezing Temperature on...Ch. 8.2 - The article Influence of Freezing Temperature on...Ch. 8.3 - True or false: a. For any set of data, there is...Ch. 8.3 - The article Experimental Design Approach for the...Ch. 8.3 - Prob. 3ECh. 8.3 - An engineer measures a dependent variable y and...Ch. 8.3 - Prob. 5ECh. 8.3 - The following MINITAB output is for a best subsets...Ch. 8.3 - Prob. 7ECh. 8.3 - Prob. 8ECh. 8.3 - (Continues Exercise 7 in Section 8.1.) To try to...Ch. 8.3 - Prob. 10ECh. 8.3 - Prob. 11ECh. 8.3 - Prob. 12ECh. 8.3 - The article Ultimate Load Analysis of Plate...Ch. 8.3 - Prob. 14ECh. 8.3 - Prob. 15ECh. 8.3 - Prob. 16ECh. 8.3 - The article Modeling Resilient Modulus and...Ch. 8.3 - The article Models for Assessing Hoisting Times of...Ch. 8 - The article Advances in Oxygen Equivalence...Ch. 8 - Prob. 2SECh. 8 - Prob. 3SECh. 8 - Prob. 4SECh. 8 - In a simulation of 30 mobile computer networks,...Ch. 8 - The data in Table SE6 (page 649) consist of yield...Ch. 8 - Prob. 7SECh. 8 - Prob. 8SECh. 8 - Refer to Exercise 2 in Section 8.2. a. Using each...Ch. 8 - Prob. 10SECh. 8 - The data presented in the following table give the...Ch. 8 - The article Enthalpies and Entropies of Transfer...Ch. 8 - Prob. 13SECh. 8 - Prob. 14SECh. 8 - The article Measurements of the Thermal...Ch. 8 - The article Electrical Impedance Variation with...Ch. 8 - The article Groundwater Electromagnetic Imaging in...Ch. 8 - Prob. 18SECh. 8 - Prob. 19SECh. 8 - Prob. 20SECh. 8 - Prob. 21SECh. 8 - Prob. 22SECh. 8 - The article Estimating Resource Requirements at...Ch. 8 - Prob. 24SE
Additional Math Textbook Solutions
Find more solutions based on key concepts
Ten equally qualified marketing assistants are candidates for promotion to associate buyer; seven are men and t...
An Introduction to Mathematical Statistics and Its Applications (6th Edition)
The manufacturer of a nationally distributed brand of potato chips wants to determine the feasibility of changi...
Basic Business Statistics, Student Value Edition (13th Edition)
Teacher Salaries
The following data from several years ago represent salaries (in dollars) from a school distri...
Elementary Statistics: A Step By Step Approach
Use the model developed in Example 1.5 to predict the total sales for weeks 2 through 16, and compare the resul...
Business Analytics
31. Putting It Together: A Tornado Model Is the width of a tornado related to the amount of distance for which ...
Statistics: Informed Decisions Using Data (5th Edition)
Knowledge Booster


Learn more about
Need a deep-dive on the concept behind this application? Look no further. Learn more about this topic, statistics and related others by exploring similar questions and additional content below.Similar questions
- 4. The table shows data on the number of visitors to the Malaysia in a month, v (1000s), and the amount of money they spent, m (MYR millions), for each of 8 months (CO2, C3, PO1) Number of visitors, 2450 2480 2540 2420 2350 2290 2400 2460 v (1000s) Amount of money spent, 1370 1350 1400 1330 1270 1210 1330 1350 m (MYR millions) a) Solve product moment correlation coefficient between v and m. b) Describe the reason to support fitting a regression model of the form m = Bo + Biv to these data c) Find the value of ß; correct to 3 decimal places d) Illustrate the equation of the regression line of m on v e) Interpret your value of ß; f) Use your answer to part (d) to estimate the amount of money spent when the number of visitors to Malaysia in a month is 2,500,000 g) Comment on the reliability of your estimate in part (f). Give your reason.arrow_forwardLet X1, .... Xn be a random sample from a population with location pdf f(x-Q). Show that the order statistics, T(X1, ...., Xn) = (X(1), ... X(n)) are a sufficient statistics for Q and no further reduction is possible?arrow_forwardCan you find the amount of salt A in the tank at any time t?arrow_forward
- Let yt = φyt−1 + et with et ∼ WN(0,σ2) and |φ| < 1. Consider the over-differenced process wt = (1 − L)yt.(i) What is the model followed by wt? (ii) Is wt invertible? (iii) Obtain V [wt] and compare its magnitude with V [yt] and hence comment on the impact of over-differencing on the variance of a stationary process.arrow_forwardLet X1, . . . , Xn be iid with pdf f(x) = 1 x √ 2πθ2 e − (log(x)−θ1) 2 2θ2 , −∞ < x < ∞, and unknown parameters θ1 and θ2. Find the maximum likelihood estimators for θ1 and θ2, respectivelyarrow_forwardThe article “Mechanistic-Empirical Design of Bituminous Roads: An Indian Perspective” (A. Das and B. Pandey, Journal of Transportation Engineering, 1999:463–471) presents an equation of the form y = a(1/x1)b(1/x2)c for predicting the number of repetitions for laboratory fatigue failure (y) in terms of the tensile strain at the bottom of the bituminous beam (x1) and the resilient modulus (x2). Transform this equation into a linear model, and express the linear model coefficients in terms of a, b, and c.arrow_forward
- Consider the following 10 measurements about the cohesion of a soil: 12 kPa, 14 kPa, 15 kPa, 14.5 kPa, 16.0 kPa, 18 kPa, 15 kPa, 16.2 kPa, 17. 6 kPa, 13 kPa. Work out the solutions of the following two problems, assuming the cohesion follows the normal and lognormal distributions, respectively. (1) Draw the PDF of the cohesion; (2) Evaluate the probability that the cohesion based on the PDF is less than 5 kPa, 10 kPa, and 15 kPa; (3) Assess the effect of the type of distribution on the results.arrow_forwardAs an industrial engineer is working a test of material used to on a certain product to determine whether it is more economical to repair a damaged area rather than replace the entire structure. The engineer obtained the following data on the bond length (x variable) vs. the rupture load (y variable) Bond Length (mm) Rupture Load (N) 50 17,052 50 14,063 80 26,264 80 19,600 110 21,952 110 26,362 140 26,362 140 26,754 170 31,654 170 32,928 Find the 95% Confidence Interval for the conditional mean of the response variable at x = 140arrow_forwardwe investigate if a period of time feels longer or shorter when people are bored compacted to when they are not bored. using independent samples, we obtain these estimates of the time period (in minutes) sample 1 (bored) xbar= 14.5 s2x= 10.22 n= 28 sample 2(not bored) xbar=9.0 s2x=14.6 n=34 (a) what are Ho and Ha? (b) compute t-obt (c) with alpha =.05, what is t-crit?arrow_forward
- Please show me your solutions and interpretations. Show the completehypothesis-testing procedure.An article in the ASCE Journal of Energy Engineering (1999, Vol. 125, pp. 59–75) describes a study of the thermal inertia properties of autoclaved aerated concrete used as a building material. Five samples of the material were tested in a structure, and the average interior temperatures (°C) reported were as follows: 23.01, 22.22, 22.04, 22.62, and 22.59. Test that the average interior temperature is equal to 22.5 °C using α = 0.05.arrow_forward1. Find the critical value(s) and identify the rejection region(s).arrow_forward: Calculate the coefficients of skewness and kurtosis of the following frequency distribution. X 0 1 2 3 4 5 Frequency 2 2 4 6 8 3arrow_forward
arrow_back_ios
SEE MORE QUESTIONS
arrow_forward_ios
Recommended textbooks for you
 MATLAB: An Introduction with ApplicationsStatisticsISBN:9781119256830Author:Amos GilatPublisher:John Wiley & Sons Inc
 Probability and Statistics for Engineering and th...StatisticsISBN:9781305251809Author:Jay L. DevorePublisher:Cengage Learning
 Statistics for The Behavioral Sciences (MindTap C...StatisticsISBN:9781305504912Author:Frederick J Gravetter, Larry B. WallnauPublisher:Cengage Learning
 Elementary Statistics: Picturing the World (7th E...StatisticsISBN:9780134683416Author:Ron Larson, Betsy FarberPublisher:PEARSON
 The Basic Practice of StatisticsStatisticsISBN:9781319042578Author:David S. Moore, William I. Notz, Michael A. FlignerPublisher:W. H. Freeman
 Introduction to the Practice of StatisticsStatisticsISBN:9781319013387Author:David S. Moore, George P. McCabe, Bruce A. CraigPublisher:W. H. Freeman
MATLAB: An Introduction with Applications
Statistics
ISBN:9781119256830
Author:Amos Gilat
Publisher:John Wiley & Sons Inc
Probability and Statistics for Engineering and th...
Statistics
ISBN:9781305251809
Author:Jay L. Devore
Publisher:Cengage Learning
Statistics for The Behavioral Sciences (MindTap C...
Statistics
ISBN:9781305504912
Author:Frederick J Gravetter, Larry B. Wallnau
Publisher:Cengage Learning
Elementary Statistics: Picturing the World (7th E...
Statistics
ISBN:9780134683416
Author:Ron Larson, Betsy Farber
Publisher:PEARSON
The Basic Practice of Statistics
Statistics
ISBN:9781319042578
Author:David S. Moore, William I. Notz, Michael A. Fligner
Publisher:W. H. Freeman
Introduction to the Practice of Statistics
Statistics
ISBN:9781319013387
Author:David S. Moore, George P. McCabe, Bruce A. Craig
Publisher:W. H. Freeman
Hypothesis Testing using Confidence Interval Approach; Author: BUM2413 Applied Statistics UMP;https://www.youtube.com/watch?v=Hq1l3e9pLyY;License: Standard YouTube License, CC-BY
Hypothesis Testing - Difference of Two Means - Student's -Distribution & Normal Distribution; Author: The Organic Chemistry Tutor;https://www.youtube.com/watch?v=UcZwyzwWU7o;License: Standard Youtube License