
Essentials of Business Analytics (MindTap Course List)
2nd Edition
ISBN: 9781305627734
Author: Jeffrey D. Camm, James J. Cochran, Michael J. Fry, Jeffrey W. Ohlmann, David R. Anderson
Publisher: Cengage Learning
expand_more
expand_more
format_list_bulleted
Videos
Textbook Question
Chapter 8, Problem 19P
Because of high tuition costs at state and private universities, enrollments at community colleges have increased dramatically in recent years. The following data show the enrollment for Jefferson Community College for the nine most recent years:
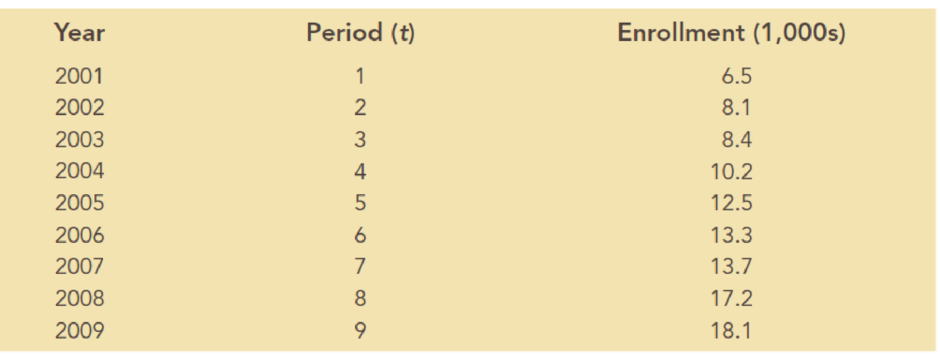
- a. Construct a time series plot. What type of pattern exists in the data?
- b. Use simple linear
regression analysis to find the parameters for the line that minimizes MSE for this time series. - c. What is the forecast for year 10?
Expert Solution & Answer

Trending nowThis is a popular solution!

Students have asked these similar questions
Consider the following time series:
Quarter
Year 1
Year 2
Year 3
1
66
63
57
2
48
40
50
3
59
61
54
4
73
76
67
(a)
Choose a time series plot.
(i)
(ii)
(iii)
(iv)
What type of pattern exists in the data? Is there an indication of a seasonal pattern?
(b)
Use a multiple linear regression model with dummy variables as follows to develop an equation to account for seasonal effects in the data: Qtr1 = 1 if quarter 1, 0 otherwise; Qtr2 = 1 if quarter 2, 0 otherwise; Qtr3 = 1 if quarter 3, 0 otherwise. For subtractive or negative numbers use a minus sign even if there is a + sign before the blank (Example: -300).
ŷ = ?? + ?? Qtr1 +?? Qtr2 + ?? Qtr3
(c)
Compute the quarterly forecasts for next year.
Year
Quarter
Ft
4
1
4
2
4
3
4
4
In the following table, the heights and salaries of the knights of 12 kingdoms have been collected. In the table, the lengths are in centimeters and the wages are in the monetary unit of the kingdom in question.
(This is the table)
Lenght Salary183 100160 92196 106186 92195 109182 101208 116169 96166 94198 101145 93168 96
So the questions regarding this table would be: (a) Fit a linear regression model to the data and determine its PNS estimates αˆ and βˆ.(b) Calculate the prediction for a knight's salary when that knight is 181 centimeters tall.(c) Estimate the variance parameter σ2 of the linear model.
R software or other software for linear regressions should not be used to solve this.
Consider the following time series data.
Quarter Year 1 Year 2 Year 3
1 4 6 7
2 2 3 6
3 3 5 6
4 5 7 8
Choose the correct time series plot.
(i)
(ii)
(iii)
(iv)
- Plot (iii) What type of pattern exists in the data?- Horizontal Pattern with Seasonality
Use a multiple regression model with dummy variables as follows to develop an equation to account for seasonal effects in the data. Qtr1 = 1 if Quarter 1, 0 otherwise; Qtr2 = 1 if Quarter 2, 0 otherwise; Qtr3 = 1 if Quarter 3, 0 otherwise. If required, round your answers to three decimal places. For subtractive or negative numbers use a minus sign even if there is a + sign before the blank. (Example: -300)Value = fill in the blank 3 + fill in the blank 4 Qtr1 + fill in the blank 5 Qtr2 + fill in the blank 6 Qtr3 + fill in the blank 7 t
Compute the quarterly forecasts for next year. If…
Chapter 8 Solutions
Essentials of Business Analytics (MindTap Course List)
Ch. 8 - Consider the following time series data:
Using...Ch. 8 - Refer to the time series data in Problem 1. Using...Ch. 8 - Problems 1 and 2 used different forecasting...Ch. 8 - Consider the following time series data:
Compute...Ch. 8 - Consider the following time series...Ch. 8 - Consider the following time series...Ch. 8 - Refer to the gasoline sales time series data in...Ch. 8 - Prob. 8PCh. 8 - Prob. 9PCh. 8 - Prob. 10P
Ch. 8 - For the Hawkins Company, the monthly percentages...Ch. 8 - Corporate triple A bond interest rates for 12...Ch. 8 - The values of Alabama building contracts (in...Ch. 8 - The following time series shows the sales of a...Ch. 8 - Prob. 15PCh. 8 - The following table reports the percentage of...Ch. 8 - Consider the following time series: a. Construct a...Ch. 8 - Consider the following time series:
Construct a...Ch. 8 - Because of high tuition costs at state and private...Ch. 8 - The Seneca Children’s Fund (SCF) is a local...Ch. 8 - The president of a small manufacturing firm is...Ch. 8 - Consider the following time series: a. Construct a...Ch. 8 - Consider the following time series...Ch. 8 - The quarterly sales data (number of copies sold)...Ch. 8 - Prob. 25PCh. 8 - South Shore Construction builds permanent docks...Ch. 8 - Hogs & Dawgs is an ice cream parlor on the border...Ch. 8 - Donna Nickles manages a gasoline station on the...Ch. 8 - The Vintage Restaurant, on Captiva Island near...
Knowledge Booster


Learn more about
Need a deep-dive on the concept behind this application? Look no further. Learn more about this topic, statistics and related others by exploring similar questions and additional content below.Similar questions
- Olympic Pole Vault The graph in Figure 7 indicates that in recent years the winning Olympic men’s pole vault height has fallen below the value predicted by the regression line in Example 2. This might have occurred because when the pole vault was a new event there was much room for improvement in vaulters’ performances, whereas now even the best training can produce only incremental advances. Let’s see whether concentrating on more recent results gives a better predictor of future records. (a) Use the data in Table 2 (page 176) to complete the table of winning pole vault heights shown in the margin. (Note that we are using x=0 to correspond to the year 1972, where this restricted data set begins.) (b) Find the regression line for the data in part ‚(a). (c) Plot the data and the regression line on the same axes. Does the regression line seem to provide a good model for the data? (d) What does the regression line predict as the winning pole vault height for the 2012 Olympics? Compare this predicted value to the actual 2012 winning height of 5.97 m, as described on page 177. Has this new regression line provided a better prediction than the line in Example 2?arrow_forwardThe president of small manufacturing firm is concerned about the continual increase in manufacturing costs over the past several years. The following figures provide a time series of the cost per unit for the firm’s leading product over the past eight years. Year Cost/Unit ($) Year Cost/Unit ($) 1 20.00 5 26.60 2 24.50 6 30.00 3 28.20 7 31.00 4 27.50 8 36.00 Construct a time series plot. What type of pattern exists in the data? Use simple linear regression analysis to find the parameters for the line that minimizes MSE for this time series. What is the average cost increase that the firm has been realizing per year? Compute an estimate of the cost/unit for next year.arrow_forwardMovieflix, an online movie streaming service that offers a wide variety of award-winning TV shows, movies, animes, and documentaries, would like to determine the mathematical trend of memberships in order to project future needs. Year 2013 2014 2015 2016 2017 2018 2019 2020 2021 Membership 17 16 16 21 20 20 23 25 24 Use the following time series data, to develop a regression equation relating memberships to time. Forecast 2023 membership Assuming the COVID-19 pandemic comes to an end in 2021, in your opinion, how will this affect membership? Why? How will this affect your prediction?arrow_forward
- A researcher notes that, in a certain region, a disproportionate number of software millionaires were born around the year 1955. Is this a coincidence, or does birth year matter when gauging whether a software founder will besuccessful? The researcher investigated this question by analyzing the data shown in the accompanying table. Complete parts a through c below. a. Find the coefficient of determination for the simple linear regression model relating number (y) of software millionaire birthdays in a decade to total number (x) of births in the region. Interpret the result. The coefficient of determination is 1.___? (Round to three decimal places as needed.) This value indicates that 2.____ of the sample variation in the number of software millionaire birthdays is explained by the linear relationship with the total number of births in the region. (Round to one decimal place as needed.) b. Find the coefficient of determination for the simple linear regression model…arrow_forwardThe operations manager of a musical instrument distributor feels that the demand for Bass Drums may be related to the number of television appearances by the popular rick group Green Shades during the previous month. The manager has collected the data shown in the following table. Demand for Bass Drums 3 6 7 5 10 8 Green Shades TV appearances 3 4 7 6 8 5 Develop the linear regression equation to forecast. Forecast demand for Bass Drums when Green Shades’ TV appearances are 10. Compute MSE and standard deviation for Problem 8.arrow_forwardConsider the following estimated regression model relating annual salary to years of education and work experience. Estimated Salary=10,737.30+2872.43(Education)+1129.1(Experience)Estimated Salary=10,737.30+2872.43(Education)+1129.1(Experience) Suppose an employee with 44 years of education has been with the company for 1111 years (note that education years are the number of years after 8th8th grade). According to this model, what is his estimated annual salary?arrow_forward
arrow_back_ios
arrow_forward_ios
Recommended textbooks for you
 College AlgebraAlgebraISBN:9781305115545Author:James Stewart, Lothar Redlin, Saleem WatsonPublisher:Cengage Learning
College Algebra
Algebra
ISBN:9781305115545
Author:James Stewart, Lothar Redlin, Saleem Watson
Publisher:Cengage Learning
Time Series Analysis Theory & Uni-variate Forecasting Techniques; Author: Analytics University;https://www.youtube.com/watch?v=_X5q9FYLGxM;License: Standard YouTube License, CC-BY
Operations management 101: Time-series, forecasting introduction; Author: Brandoz Foltz;https://www.youtube.com/watch?v=EaqZP36ool8;License: Standard YouTube License, CC-BY