Videos
To write:
A
Answer to Problem 27E
Solution:
The file is,
%MATLAB code to load the data and create a data structure file.
%structure file.
stormdata = [321 2.4 1.5]
save stormdata.dat stormdata -ascii
stormdata = [111 3.3 12.1]
save stormdata.dat stormdata -ascii
clear
load stormdata.dat
%end of function file
%The function file should be placed in the same folder
The function file is,
%MATLAB code to print a table between stormdatavector and intensity.
%function file.
function tableprint(stormdatavector, intensity)
for i = 1:length(stormdatavector)
fprintf('%20.1f\t%20.1f\t%20.1f|t%20f\n', stormdatavector(i).locationcode, stormdatavector(i).rainfallamount, stormdatavector(i).stormduration, intensity(i))
end
end
%end of function file
%The function file should be placed in the same folder.
The function file is,
%MATLAB code to calculate the average intensity.
%function file.
function avgintensity(intensity)
intensitysum = 0;
for i = 1:length(intensity)
intensitysum = intensitysum + intensity(i);
end
avgintensity = intensitysum/length(intensity);
fprintf('Average intensity of storm is %f\n', avgintensity)
end
%end of function file
%The function file should be placed in the same folder.
The function file is,
%MATLAB code to find the information about mostintensestorm.
%function file.
function mostintensestorm(stormvector, intensity)
for i = 1:length(intensity)
for j = i + 1:length(intensity)
if intensity(i)>intensity(j)
temp = intensity(i);
intensity(i) = intensity (j);
intensity(j) = temp;
end
end
end
fprintf('the information of most intense storm is:%f\n', intensity(length(intensity)))
tempindex = index(stormvector, intensity);
fprintf('the index of most intense storm is:%d\n', tempindex);
fprintf('%20s|t%20s\t%20s\t%20s\n','location code','rainfall amount','storm duration','intensities')
fprintf('%20.1f\t%20.1f\t%20.1f\t%20f\n', stormvector(tempindex).locationcode, stormvector(tempindex).rainfallamount, stormvector(tempindex).stormduration, intensity(length(intensity)))
end
function index = index(stormvector, intensity)
for i = 1:length(stormvector)
if intensity(length(intensity)) ==stormvector(i).rainfallamount/stormvector(i).stormduration
index = i;
break;
end
end
end
%end of function file
%The function file should be placed in the same folder.
The function file is,
%MATLAB code to find the output.
%function file.
fprintf('%20s\t%20s\t%20s\t%20s\n','location code','rainfall amount','storm duration','intensities')
for i = 1:size(stormdata, 1)
for j = 1:length(stormdata(i))
stormvector(i) = struct('locationcode', stormdata(i, j),'rainfallamount', stormdata(i, j+1),'stormduration', stormdata(i, j+2));
intensity(i) = stormvector(i).rainfallamount/stormvector(i).stormduration;
end
end
tableprint(stormvector, intensity)
avgintensity(intensity)
mostintensestorm(stormvector, intensity)
%end of function file
%The function file should be placed in the same folder.
Explanation of Solution
The output is,
The average intensity is,
The location code is,
The rainfall amount is,
MATLAB Code:
clc
clear all
close all
%MATLAB code to load the data and create a data structure file.
%structure file.
stormdata = [321 2.4 1.5]
save stormdata.dat stormdata -ascii
stormdata = [111 3.3 12.1]
save stormdata.dat stormdata -ascii
clear
load stormdata.dat
%end of structure file
%The file should be placed in the same folder
output;
%The function file should be placed in the same folder
%MATLAB code to print a table between stormdatavector and intensity.
%function file.
function tableprint(stormdatavector, intensity)
for i = 1:length(stormdatavector)
fprintf('%20.1f\t%20.1f\t%20.1f|t%20f\n', stormdatavector(i).locationcode, stormdatavector(i).rainfallamount, stormdatavector(i).stormduration, intensity(i))
end
end
%end of function file
%The function file should be placed in the same folder.
%MATLAB code to calculate the average intensity.
%function file.
function avgintensity(intensity)
intensitysum = 0;
for i = 1:length(intensity)
intensitysum = intensitysum + intensity(i);
end
avgintensity = intensitysum/length(intensity);
fprintf('Average intensity of storm is %f\n', avgintensity)
end
%end of function file
%The function file should be placed in the same folder.
%MATLAB code to find the information about mostintensestorm.
%function file.
function mostintensestorm(stormvector, intensity)
for i = 1:length(intensity)
for j = i + 1:length(intensity)
if intensity(i)>intensity(j)
temp = intensity(i);
intensity(i) = intensity (j);
intensity(j) = temp;
end
end
end
fprintf('the information of most intense storm is:%f\n', intensity(length(intensity)))
tempindex = index(stormvector, intensity);
fprintf('the index of most intense storm is:%d\n', tempindex);
fprintf('%20s|t%20s\t%20s\t%20s\n','location code','rainfall amount','storm duration','intensities')
fprintf('%20.1f\t%20.1f\t%20.1f\t%20f\n', stormvector(tempindex).locationcode, stormvector(tempindex).rainfallamount, stormvector(tempindex).stormduration, intensity(length(intensity)))
end
function index = index(stormvector, intensity)
for i = 1:length(stormvector)
if intensity(length(intensity)) ==stormvector(i).rainfallamount/stormvector(i).stormduration
index = i;
break;
end
end
end
%end of function file
%The function file should be placed in the same folder.
%MATLAB code to find the output.
%function file.
fprintf('%20s\t%20s\t%20s\t%20s\n','location code','rainfall amount','storm duration','intensities')
for i = 1:size(stormdata, 1)
for j = 1:length(stormdata(i))
stormvector(i) = struct('locationcode', stormdata(i, j),'rainfallamount', stormdata(i, j+1),'stormduration', stormdata(i, j+2));
intensity(i) = stormvector(i).rainfallamount/stormvector(i).stormduration;
end
end
tableprint(stormvector, intensity)
avgintensity(intensity)
mostintensestorm(stormvector, intensity)
%end of function file
%The function file should be placed in the same folder.
Save the MATLAB script with name, chapter8_54793_8_27E.m and function files with names tableprint.m, avgintensity.m, mostintensestorm.m and output.m in the current folder. Execute the functions by typing the functions name at the command window to generate output.
Result:
The result is,
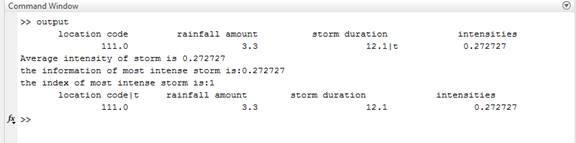
Therefore, the result is stated above.
Want to see more full solutions like this?
Chapter 8 Solutions
MATLAB: A Practical Introduction to Programming and Problem Solving


- A car wash offers the following optional services to the basic wash: clear coat wax, triple foam polish, undercarriage wash, rust inhibitor, wheel brightener, air freshener, and interior shampoo. How many washes are possible if any number of options can be added to the basic wash?arrow_forwardPLEASE ANSWER THE A-E SUB-PARTSarrow_forwardshow step by step and provide explainationarrow_forward

 Mathematics For Machine TechnologyAdvanced MathISBN:9781337798310Author:Peterson, John.Publisher:Cengage Learning,
 Algebra: Structure And Method, Book 1AlgebraISBN:9780395977224Author:Richard G. Brown, Mary P. Dolciani, Robert H. Sorgenfrey, William L. ColePublisher:McDougal Littell