
(a)
To make a
(a)
Explanation of Solution
In the question it shows the relationship between the age and the price of the cars of used Corolla. Thus, the scatterplot of the data is as follows:
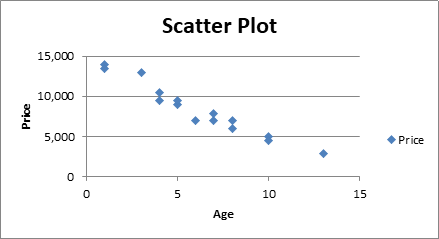
In the scatterplot, the age is on the horizontal axis and the price is on the vertical axis.
(b)
To describe the association between age and price of a used Corolla.
(b)
Explanation of Solution
In the question it shows the relationship between the age and the price of the cars of used Corolla. In the above scatterplot we can see that the points are in the downward direction. Thus, we can say that the relationship between the age and the price is negative. The points in the scatterplot are less scattered and in a straight line. Thus the relationship between the age and the price of the Corolla is negative, strong and linear.
(c)
To explain do you think a linear model is appropriate.
(c)
Answer to Problem 41E
Yes, the linear model is appropriate.
Explanation of Solution
In the question it shows the relationship between the age and the price of the cars of used Corolla. We can say that a linear model is appropriate for this data because we can see that the points are in the downward direction. Therefore the relationship between the age and the price is negative. And the points in the scatterplot are less scattered and in a straight line. Thus the relationship between the age and the price of the Corolla is negative, strong and linear.
(d)
To find out what is the
(d)
Answer to Problem 41E
Explanation of Solution
In the question it shows the relationship between the age and the price of the cars of used Corolla. It is given using the computer software that:
As, we know that the points in the scatterplot are moving in a downward direction. So, the correlation would be negative. Thus, to find the correlation between the age and the price, we have following:
(e)
To explain the meaning of
(e)
Explanation of Solution
In the question it shows the relationship between the age and the price of the cars of used Corolla. And we know that,
(f)
To explain why doesn’t this model explain
(f)
Explanation of Solution
In the question it shows the relationship between the age and the price of the cars of used Corolla. Thus, this model does not explain
Chapter 8 Solutions
Stats: Modeling the World Nasta Edition Grades 9-12
Additional Math Textbook Solutions
Intro Stats, Books a la Carte Edition (5th Edition)
Introductory Statistics (10th Edition)
Introductory Statistics (2nd Edition)
Elementary Statistics Using Excel (6th Edition)
An Introduction to Mathematical Statistics and Its Applications (6th Edition)

 MATLAB: An Introduction with ApplicationsStatisticsISBN:9781119256830Author:Amos GilatPublisher:John Wiley & Sons Inc
 Probability and Statistics for Engineering and th...StatisticsISBN:9781305251809Author:Jay L. DevorePublisher:Cengage Learning
 Statistics for The Behavioral Sciences (MindTap C...StatisticsISBN:9781305504912Author:Frederick J Gravetter, Larry B. WallnauPublisher:Cengage Learning
 Elementary Statistics: Picturing the World (7th E...StatisticsISBN:9780134683416Author:Ron Larson, Betsy FarberPublisher:PEARSON
 The Basic Practice of StatisticsStatisticsISBN:9781319042578Author:David S. Moore, William I. Notz, Michael A. FlignerPublisher:W. H. Freeman
 Introduction to the Practice of StatisticsStatisticsISBN:9781319013387Author:David S. Moore, George P. McCabe, Bruce A. CraigPublisher:W. H. Freeman