
Concept explainers
Videos
(a)
To find out what is the regression equation and what does the slope mean.
(a)
Answer to Problem 52E
The regression line is:
Explanation of Solution
In the question, the association between the long jump performance on the high-jump results are examined. And the information is given in the table as:
| High Jump | Long Jump |
| 1.91 | 6.51 |
| 1.76 | 6.3 |
| 1.85 | 6.51 |
| 1.7 | 6.25 |
| 1.79 | 6.21 |
| 1.76 | 6.42 |
| 1.85 | 6.19 |
| 1.82 | 6.23 |
| 1.79 | 6.02 |
| 1.7 | 5.84 |
| 1.67 | 6.36 |
| 1.82 | 6.35 |
| 1.85 | 6.1 |
| 1.7 | 6.02 |
| 1.79 | 5.97 |
| 1.85 | 5.9 |
| 1.73 | 6.03 |
| 1.79 | 6.36 |
| 1.7 | 6.21 |
| 1.67 | 6.15 |
| 1.76 | 5.98 |
| 1.79 | 6.16 |
| 1.73 | 6.02 |
| 1.7 | 5.92 |
| 1.7 | 6.22 |
| 1.7 | 5.7 |
Thus, we will create a regression line by using excel as:
We will first select the data given in the table and then go to the insert tab. In the tab we will use the
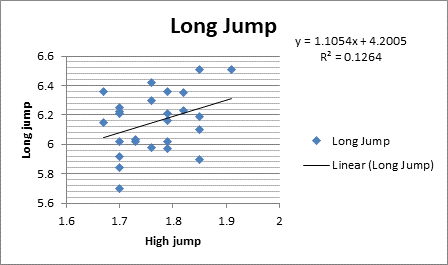
Thus, the regression line for this context is:
Thus, the slope of the line interprets that long jump height is higher, on average, by
(b)
To find out what percentage of the variability in long jumps can be accounted for by high-jumps performances.
(b)
Answer to Problem 52E
Explanation of Solution
In the question, the association between the long jump performance on the high-jump results are examined. And the regression line is:
Thus, from the above scatterplot in part (a) we can see that the coefficient of determination is also given, that is:
Thus, the value of
(c)
To explain do good high jumpers tend to be good long jumpers.
(c)
Answer to Problem 52E
Yes, good high jumpers tend to be good long jumpers.
Explanation of Solution
In the question, the association between the long jump performance on the high-jump results are examined. And the regression line is:
Thus, we can say that good high jumpers tend to be good long jumpers because the slope is positive as calculated in part (a) and this implies that higher values are better for both variables.
(d)
To explain what does the residuals plot reveal about the model.
(d)
Explanation of Solution
In the question, the association between the long jump performance on the high-jump results are examined. And the regression line is:
The residual plot is as:
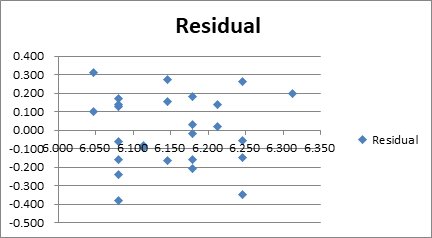
From the above residual plot we can see that the average high runners tend to have closer to average long jumps than the really low of high high-jumps.
(e)
To explain do you think this is a useful model and would you use it to predict long-jump performance.
(e)
Answer to Problem 52E
Yes, this is useful model and it is used to predict long-jump performance.
Explanation of Solution
In the question, the association between the long jump performance on the high-jump results are examined. And the regression line is:
Thus, we think that this model is especially useful model because the residual standard deviation is a lot smaller than the standard deviation of all long jumps. The model does appear to do a very good job of predicting as it does give the accurate result.
Chapter 8 Solutions
Stats: Modeling the World Nasta Edition Grades 9-12
Additional Math Textbook Solutions
Statistics: The Art and Science of Learning from Data (4th Edition)
Introductory Statistics (10th Edition)
Elementary Statistics: Picturing the World (6th Edition)
Statistics for Psychology
Statistics for Business and Economics (13th Edition)
Elementary Statistics Using Excel (6th Edition)


 MATLAB: An Introduction with ApplicationsStatisticsISBN:9781119256830Author:Amos GilatPublisher:John Wiley & Sons Inc
 Probability and Statistics for Engineering and th...StatisticsISBN:9781305251809Author:Jay L. DevorePublisher:Cengage Learning
 Statistics for The Behavioral Sciences (MindTap C...StatisticsISBN:9781305504912Author:Frederick J Gravetter, Larry B. WallnauPublisher:Cengage Learning
 Elementary Statistics: Picturing the World (7th E...StatisticsISBN:9780134683416Author:Ron Larson, Betsy FarberPublisher:PEARSON
 The Basic Practice of StatisticsStatisticsISBN:9781319042578Author:David S. Moore, William I. Notz, Michael A. FlignerPublisher:W. H. Freeman
 Introduction to the Practice of StatisticsStatisticsISBN:9781319013387Author:David S. Moore, George P. McCabe, Bruce A. CraigPublisher:W. H. Freeman