
APPLICATIONS+INVESTIGATIONS IN EARTH
18th Edition
ISBN: 9781533902405
Author: Tarbuck
Publisher: Hayden-McNeil Publishing
expand_more
expand_more
format_list_bulleted
Textbook Question
Chapter 8, Problem 4LR
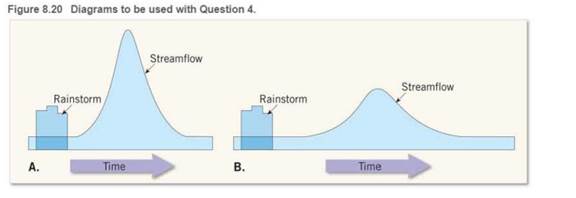
The diagrams in Figure 8.20 show lag time between rainfall and peak flow (flooding) for an urban area and a rural area Which diagram-{A or B}-represents a rural area? Explain your choice.
Expert Solution & Answer

Learn your wayIncludes step-by-step video

schedule09:28
Students have asked these similar questions
Which of the following is not an example of external variable?
O a. Habits
O b. Location
O cC. Weather
O d. Flood
Write a scope statement for the case study
The department of public works for a large city has decided to develop a Web-based pothole tracking and repair system (PHTRS). The department hired a new system analyst to analyse and design the web-based PHTRS. The analyst came up with the following description of their requirement:
Citizens can log onto a website to view and make potholes report. The report contains the location and severity of potholes. As potholes are reported they are logged with a "public works department repair system" and are assigned with the given data. The recorded potholes consist of information as follows:
an identifying number,
stored with street address,
size (on a scale of 1 to 10),
location (middle, curb, etc.),
district,
and repair priority (determined from the size of the pothole).
Further, a work order data is generated for each newly added pothole in the system. A work order is issued by an authorised PHTRS employee. A repair crew is allocated to repair…
Please read the direcitons on the first picture and answer the problems on the second picture. Thanks for your time.
Chapter 8 Solutions
APPLICATIONS+INVESTIGATIONS IN EARTH
Ch. 8.1 - Sketch, label, and discuss the hydrologic cycle....Ch. 8.1 - Sketch, label, and discuss the hydrologic cycle....Ch. 8.1 - Sketch, label, and discuss the hydrologic cycle....Ch. 8.1 - Sketch, label, and discuss the hydrologic cycle....Ch. 8.1 - Sketch, label, and discuss the hydrologic cycle....Ch. 8.1 - Label the drawing in Figure 8.2 with the letters...Ch. 8.2 - Of the three materials you tested coarse sand,...Ch. 8.2 - Prob. 2ACh. 8.2 - Prob. 3ACh. 8.2 - Prob. 4A
Ch. 8.3 - Does urbanization increase or decrease the peak...Ch. 8.3 - What is the effect of urbanization on lag time the...Ch. 8.3 - Does total runoff occur over a longer or shorter...Ch. 8.3 - Based on what you have learned from the...Ch. 8.4A - Compare the stereogram in Figure 8.7 to the map in...Ch. 8.4A - Is the terrain in section 14, located on the west...Ch. 8.4A - Label the areas that topographically resemble...Ch. 8.4A - Describe the topography in the lower half of...Ch. 8.4A - Section 17 contains a portion of the valley...Ch. 8.4A - Which of the following best describes the shape of...Ch. 8.4A - Calculate the gradient, or slope, of this portion...Ch. 8.4A - Approximately how many feet is the Missouri River...Ch. 8.4A - What are the features in the river labeled with...Ch. 8.4A - Based on your answer to Question 9, are the...Ch. 8.4A - Over time, as tributaries erode and lengthen their...Ch. 8.4B - Draw an arrow on the map to indicate the direction...Ch. 8.4B - Use the BM elevations from Question 1 to calculate...Ch. 8.4B - Approximately how many feet is the Genesee River...Ch. 8.4B - The path of the Genesee River can best be...Ch. 8.4B - Which phrase most accurately describes most of the...Ch. 8.4B - Use the fractional scales on the Angelica...Ch. 8.4C - Approximately what percentage of the map area is...Ch. 8.4C - Prob. 2ACh. 8.4C - Prob. 3ACh. 8.4C - Prob. 4ACh. 8.4C - Prob. 5ACh. 8.4C - Write a statement that compares the width of the...Ch. 8.4C - Is the Red River actively downcutting its channel...Ch. 8.4C - On which of the three maps is the gradient of the...Ch. 8.4C - Choosing from Figure 8.6, Figure 8.8, or Figure...Ch. 8.5 - Label the zone of saturation, the unsaturated...Ch. 8.5 - Describe the shape of the water table in...Ch. 8.5 - Whenever a substantial amount of water is...Ch. 8.5 - Use a pencil to shade the area between the dashed...Ch. 8.5 - How does the drop in the water table during a...Ch. 8.6 - Calculate the elevation of the water table at each...Ch. 8.6 - Assume that a dye was put into well A on May 10,...Ch. 8.7 - What is the general relationship between ground...Ch. 8.7 - What was the total ground subsidence, and what was...Ch. 8.7 - During the period shown on the graph, on average,...Ch. 8.7 - Was the ground subsidence that occurred between...Ch. 8.7 - Notice that minimal subsidence occurred from 1935...Ch. 8.8 - Locate three sinkholes depressions on the map and...Ch. 8.8 - Notice that several sinkholes have water in them....Ch. 8.8 - Describe what is happening to Gardner Creek in the...Ch. 8 - Write a statement or two describing the movement...Ch. 8 - Assume that you need to determine the rate at...Ch. 8 - Write a brief paragraph summarizing the results of...Ch. 8 - The diagrams in Figure 8.20 show lag time between...Ch. 8 - On Figure 8.21, identify and label as many...Ch. 8 - Name and describe two features you would expect to...Ch. 8 - On Figure 8.22, identify and label as many...Ch. 8 - Assume that you have decided to drill a water...Ch. 8 - Name and describe two features you would expect to...
Additional Business Textbook Solutions
Find more solutions based on key concepts
Name and describe two features you would expect to find on the floodplain of a widely meandering river near its...
Applications and Investigations in Earth Science (8th Edition)
Explain why the peak and minimum in the seasonal cycle occur when they do. (Consider the life cycle of plants a...
Exercises for Weather & Climate (9th Edition)
Near the top of the Citigroup Center building in New York City, there is an object with mass of 4.00105 kg on s...
University Physics Volume 1
Repeat part (a) of Problem 62 for the path ACDA in Fig. 18.23. (b) How much heat flows into or out of the gas o...
Essential University Physics: Volume 1 (3rd Edition)
For Practice 1.1
Is each change physical or chemical? Which kind of property (chemical or physical) is demonst...
Principles of Chemistry: A Molecular Approach (3rd Edition)
Some organizations are starting to envision a sustainable societyone in which each generation inherits sufficie...
Campbell Essential Biology (6th Edition) - standalone book
Knowledge Booster

Similar questions
- Which of the following statements is correct with respect to a Gantt chart?a. The x-axis of a Gantt chart shows a time line.b. The y-axis shows the activities of a project.c. The Gantt chart itself does not show all dependencies among activities.d. The Gantt chart is named after 19th-century industrialist Henry Gantt.e. All of these statements are correct.arrow_forwardGiven the data in the following table, what is the IRR of Project B?arrow_forwardWhy do changes in the variables vary by the city?arrow_forward
- What would be the short-term and long-term recommendations for the Appaloosa County Day Care Center facility?arrow_forwardHow many paths are there in the network? Enter your response as a number ONLY. Refer to Problem 2 of the Practice Problems download. What is the project's expected completion time? Enter your response as a number only. DO NOT include any words such as "weeks" in your answer. Refer to Problem 2 of the Practice Problems download. What is the critical path for the network/project? Refer to Problem 2 of the Practice Problems download. Group of answer choices A-D-E-F-G A-B-E-F-G A-C-F-G A-B-D-C-E-F-G If activity B takes an additional 3 weeks, what is the impact on the project? Refer to Problem 2 of the Practice Problems download. Group of answer choices There is no impact on the project duration. Activity B has 6 weeks of slack time. The entire project will be delayed 3 weeks (28 instead of 25 weeks). The entire project will be delayed, but it will be less than 3 weeks as Activity B has some…arrow_forwardWhat predetermined rate would be used in Department B?arrow_forward
- In the bottom-up approach basically uses historical data from similar engineering projects to estimate the costs, revenues, and other data for the current project Select one: True O Falsearrow_forwardIn a maximal flow problem, a.the flow out of a node is less than the flow into the node. b.the number of arcs entering a node is equal to the number of arcs exiting the node. c.the objective is to determine the maximum amount of flow that can enter and exit a network system in a given period of time. d.None of these choices is correct.arrow_forwardUse a weighted scoring model to help the committee choose between two projects: Booking System Upgrade and Cabin Crew Retraining. The relative weights for each criterion and the assessment of each project for these criteria are shown in the following table. Which project would you choose and why?arrow_forward
arrow_back_ios
SEE MORE QUESTIONS
arrow_forward_ios
Recommended textbooks for you

 Financial And Managerial AccountingAccountingISBN:9781337902663Author:WARREN, Carl S.Publisher:Cengage Learning,
 Managerial AccountingAccountingISBN:9781337912020Author:Carl Warren, Ph.d. Cma William B. TaylerPublisher:South-Western College Pub
 Survey of Accounting (Accounting I)AccountingISBN:9781305961883Author:Carl WarrenPublisher:Cengage Learning
Financial And Managerial Accounting
Accounting
ISBN:9781337902663
Author:WARREN, Carl S.
Publisher:Cengage Learning,
Managerial Accounting
Accounting
ISBN:9781337912020
Author:Carl Warren, Ph.d. Cma William B. Tayler
Publisher:South-Western College Pub
Survey of Accounting (Accounting I)
Accounting
ISBN:9781305961883
Author:Carl Warren
Publisher:Cengage Learning