
APPLICATIONS+INVESTIGATIONS IN EARTH
18th Edition
ISBN: 9781533902405
Author: Tarbuck
Publisher: Hayden-McNeil Publishing
expand_more
expand_more
format_list_bulleted
Textbook Question
Chapter 8.6, Problem 2A
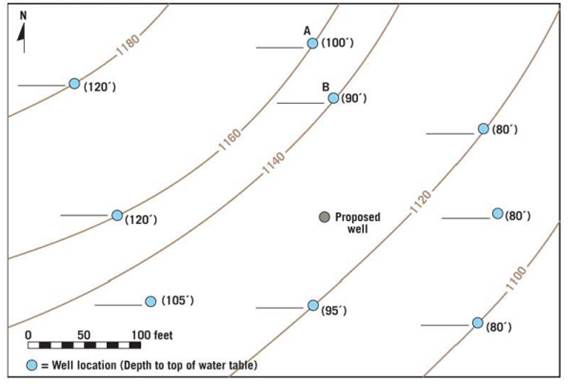
Assume that a dye was put into well A on May 10, 2017, and detected in well B on May 25, 2018. What was the rate of groundwater movement between the two wells, in centimeters per day? (Hint Convert feet to centimeters.)
Expert Solution & Answer

Learn your wayIncludes step-by-step video

schedule02:43
Students have asked these similar questions
Oil spill cleanup costs for a nation or region can be estimated by taking the average cost for the specified region and multiplying it by various “modification factors” that are a function of oil type (light crude, heavy crude, No. 4 fuel, etc.), spill size (<34 tons, 34–340 tons, etc.), location type (offshore, nearshore, in-port), cleanup method (dispersants, burning, manual), and extent of shoreline oiling (0–1 km, 2–5 km, etc.). For an average cost of $23.02 per liter and modifiers for a region in the United States of 1.32, 0.65, 1.28, 0.25, and 1.53 for oil type, spill size, location type, cleanup method, and extent of shoreline oiling, respectively, determine the estimated cleanup cost per liter of an oil spill in the region of the United States.
I drag a stick at 2 m/s through an extremely shallow rectangular box filled with oil, creating a shock wave. I measure the angle made by the wave with the line along which the stick isdragged to be 45°. What is the speed of surface waves in this box?
How much is the computed depletion rate in 20x1?
How much is the depletion in 20x2?
How much is the depletion rate to be applied in 20x3?
How much is the depletion in 20x3?
Chapter 8 Solutions
APPLICATIONS+INVESTIGATIONS IN EARTH
Ch. 8.1 - Sketch, label, and discuss the hydrologic cycle....Ch. 8.1 - Sketch, label, and discuss the hydrologic cycle....Ch. 8.1 - Sketch, label, and discuss the hydrologic cycle....Ch. 8.1 - Sketch, label, and discuss the hydrologic cycle....Ch. 8.1 - Sketch, label, and discuss the hydrologic cycle....Ch. 8.1 - Label the drawing in Figure 8.2 with the letters...Ch. 8.2 - Of the three materials you tested coarse sand,...Ch. 8.2 - Prob. 2ACh. 8.2 - Prob. 3ACh. 8.2 - Prob. 4A
Ch. 8.3 - Does urbanization increase or decrease the peak...Ch. 8.3 - What is the effect of urbanization on lag time the...Ch. 8.3 - Does total runoff occur over a longer or shorter...Ch. 8.3 - Based on what you have learned from the...Ch. 8.4A - Compare the stereogram in Figure 8.7 to the map in...Ch. 8.4A - Is the terrain in section 14, located on the west...Ch. 8.4A - Label the areas that topographically resemble...Ch. 8.4A - Describe the topography in the lower half of...Ch. 8.4A - Section 17 contains a portion of the valley...Ch. 8.4A - Which of the following best describes the shape of...Ch. 8.4A - Calculate the gradient, or slope, of this portion...Ch. 8.4A - Approximately how many feet is the Missouri River...Ch. 8.4A - What are the features in the river labeled with...Ch. 8.4A - Based on your answer to Question 9, are the...Ch. 8.4A - Over time, as tributaries erode and lengthen their...Ch. 8.4B - Draw an arrow on the map to indicate the direction...Ch. 8.4B - Use the BM elevations from Question 1 to calculate...Ch. 8.4B - Approximately how many feet is the Genesee River...Ch. 8.4B - The path of the Genesee River can best be...Ch. 8.4B - Which phrase most accurately describes most of the...Ch. 8.4B - Use the fractional scales on the Angelica...Ch. 8.4C - Approximately what percentage of the map area is...Ch. 8.4C - Prob. 2ACh. 8.4C - Prob. 3ACh. 8.4C - Prob. 4ACh. 8.4C - Prob. 5ACh. 8.4C - Write a statement that compares the width of the...Ch. 8.4C - Is the Red River actively downcutting its channel...Ch. 8.4C - On which of the three maps is the gradient of the...Ch. 8.4C - Choosing from Figure 8.6, Figure 8.8, or Figure...Ch. 8.5 - Label the zone of saturation, the unsaturated...Ch. 8.5 - Describe the shape of the water table in...Ch. 8.5 - Whenever a substantial amount of water is...Ch. 8.5 - Use a pencil to shade the area between the dashed...Ch. 8.5 - How does the drop in the water table during a...Ch. 8.6 - Calculate the elevation of the water table at each...Ch. 8.6 - Assume that a dye was put into well A on May 10,...Ch. 8.7 - What is the general relationship between ground...Ch. 8.7 - What was the total ground subsidence, and what was...Ch. 8.7 - During the period shown on the graph, on average,...Ch. 8.7 - Was the ground subsidence that occurred between...Ch. 8.7 - Notice that minimal subsidence occurred from 1935...Ch. 8.8 - Locate three sinkholes depressions on the map and...Ch. 8.8 - Notice that several sinkholes have water in them....Ch. 8.8 - Describe what is happening to Gardner Creek in the...Ch. 8 - Write a statement or two describing the movement...Ch. 8 - Assume that you need to determine the rate at...Ch. 8 - Write a brief paragraph summarizing the results of...Ch. 8 - The diagrams in Figure 8.20 show lag time between...Ch. 8 - On Figure 8.21, identify and label as many...Ch. 8 - Name and describe two features you would expect to...Ch. 8 - On Figure 8.22, identify and label as many...Ch. 8 - Assume that you have decided to drill a water...Ch. 8 - Name and describe two features you would expect to...
Additional Business Textbook Solutions
Find more solutions based on key concepts
Describe the general relationship between latitude, absorbed solar radiation, and seasonal temperature range.
Exercises for Weather & Climate (9th Edition)
Determine the molecular geometry of each polyatomic ion. a. CO32 b. CIO2 c. NO3 d. NH4+
Introductory Chemistry (5th Edition) (Standalone Book)
Why are BSL-4 suits pressurized? Why not just wear tough regular suits?
Microbiology with Diseases by Taxonomy (5th Edition)
The balance chemical equation for the reaction of solid silicon dioxide (silica) with hydrofluoric acid (HF) so...
Chemistry: Matter and Change
Answer the following questions for each compound: a. How many signals are in its 13C NMR spectrum? b. Which sig...
Organic Chemistry (8th Edition)
What is the difference between cellular respiration and external respiration?
Human Physiology: An Integrated Approach (8th Edition)
Knowledge Booster

Similar questions
- Create four new fixed asset accounts – Account type: Fixed Assets, detail type: Buildings and Accumulated Depreciation (where appropriate), account names: Original Cost (a sub account of Building) and Accumulated Depreciation (a sub account of Building), and Land with Account type: Fixed Asset, detail type: Land. I saw a sample but don't we have to make a check also? How are the 4 accounts created also?arrow_forwardDetermine the following as a result of your audit:16. How much is the cost of Land disclosed in its notes to financial statement as component of property,plant and equipment – net as of December 31, 2022?17. How much is the cost of Land Improvements disclosed in its notes to financial statement ascomponent of property, plant and equipment – net as of December 31, 2022?18. How much is the cost of Building disclosed in its notes to financial statement as component ofproperty, plant and equipment – net as of December 31, 2022?19. How much is the cost of Machineries disclosed in its notes to financial statement as component ofproperty, plant and equipment – net as of December 31, 2022?20. How much is the amount of Depreciation expense reported by Fix You Company in its statement ofcomprehensive income for the period ending December 31, 2022?arrow_forwardFor several years, many utilities have employed regression analysis to forecast monthly utility usage by residential customers using weather forecasts, the number of holidays, the number of days in the month, and other factors. For example, the Connecticut Department of Public Utility Control (CDPUC) has determined that regression, properly used, can accurately predict natural gas usage. Most public gas utilities serving Connecticut have reported levels of accuracy from 4% to 10% using regression. One company, Dominion Natural Gas Company of Ohio, uses this approach not to forecast, but to explain to customers why their natural gas bills have gone up or down compared to the prior month and to the same month of the prior year. The bill shows total MCF (thousand cubic feet of natural gas) used by the customer for that month and why the total MCF usage has changed, based on three factors: 1. Change in temperature. Each degree increase in temperature causes an increase in the number of…arrow_forward
- what would be the recorded depletion during the year?arrow_forwardThe daily water consumption for an Ohio community is normally distributed with a mean consumption of 842,061 gallons and a standard deviation of 87,901 gallons. The community water system will experience a noticeable drop in water pressure when the daily water consumption exceeds 991,628 gallons. What is the probability of experiencing such a drop in water pressure? (Round your answer to 4 decimal places. Round Z-scores to 2 decimal places.)arrow_forwardJensen Tire Auto is deciding whether to purchase a maintenance contract for its new computer wheel alignment and balancing machine. Managers feel that maintenance expense should be related to usage, and they collected the following information on weekly usage (hours) and annual maintenance expense (in hundreds of dollars). a. Develop a scatter chart with weekly usage hours as the independent variable. What does the scatter chart indicate about the relationship between weekly usage and annual maintenance expense? b. Use the data to develop an estimated regression equation that could be used to predict the annual maintenance expense for a given number of hours of weekly usage. What is the estimated regression model? c. Test whether each of the regression parameters 0 and 1 is equal to zero at a 0.05 level of significance. What are the correct interpretations of the estimated regression parameters? Are these interpretations reasonable? d. How much of the variation in the sample values of annual maintenance expense does the model you estimated in part (b) explain? e. If the maintenance contract costs 3,000 per year, would you recommend purchasing it? Why or why not?arrow_forward
- Respond to the following in a minimum of 175 words: What characteristics of a plant asset make it different from other assets? Why does GAAP require depreciation for certain plant assets? The balance in an Accumulated Depreciation - Equipment account does not represent funds to replace the equipment when it wears out; instead, what does it represent?arrow_forwardA highway department is studying the relationship between traffic flow and speed during rush hour on Highway 193. The data in the file TrafficFlow were collected on Highway 193 during 100 recent rush hours. a. Develop a scatter chart for these data. What does the scatter chart indicate about the relationship between vehicle speed and traffic flow? b. Develop an estimated simple linear regression equation for the data. How much variation in the sample values of traffic flow is explained by this regression model? Use a 0.05 level of significance to test the relationship between vehicle speed and traffic flow. What is the interpretation of this relationship? c. Develop an estimated quadratic regression equation for the data. How much variation in the sample values of traffic flow is explained by this regression model? Test the relationship between each of the independent variables and the dependent variable at a 0.05 level of significance. How would you interpret this model? Is this model superior to the model you developed in part (b)? d. As an alternative to fitting a second-order model, fit a model using a piecewise linear regression with a single knot. What value of vehicle speed appears to be a good point for the placement of the knot? Does the estimated piecewise linear regression provide a better fit than the estimated quadratic regression developed in part (c)? Explain. e. Separate the data into two sets such that one data set contains the observations of vehicle speed less than the value of the knot from part (d) and the other data set contains the observations of vehicle speed greater than or equal to the value of the knot from part (d). Then fit a simple linear regression equation to each data set. How does this pair of regression equations compare to the single piecewise linear regression with the single knot from part (d)? In particular, compare predicted values of traffic flow for values of the speed slightly above and slightly below the knot value from part (d). f. What other independent variables could you include in your regression model to explain more variation in traffic flow?arrow_forwardusing hte information from the photos, can you please help me prepare the appropriate schedules to calculate any depreciation/amortization for 2020arrow_forward
- I know that to determine the depreciation per unit you take the cost minus the residual value and divide that by the total units of activity. Then you compute the depreciation expense by multiplying the depreciation per unit and the total units of activity. (Which can be expressed in hours, miles driven or quantity produced) I got the first part correct but I cant seem to get any further than that. Each answer I input it marks incorrect.arrow_forwardIn a manufacturing process the assembly line speed (feet per minute) was thought to affect the number of defective parts found during the inspection process. To test this theory, managers devised a situation in which the same batch of parts was inspected visually at a variety of line speeds. They collected the following data: Develop a scatter chart with line speed as the independent variable. What does the scatter chart indicate about the relationship between line speed and the number of defective parts found? Use the data to develop an estimated regression equation that could be used to predict the number of defective parts found, given the line speed. What is the estimated regression model? Test whether each of the regression parameters β0 and β1 is equal to zero at a 0.01 level of significance. What are the correct interpretations of the estimated regression parameters? Are these interpretations reasonable? How much of the variation in the number of defective parts found for the sample data does the model you estimated in part (b) explain?arrow_forwardJohnson Filtration. Inc., provides maintenance service for water filtration systems throughout southern Florida. Customers contact Johnson with requests for maintenance service on their water filtration systems. To estimate the service time and the service cost. Johnson’s managers want to predict the repair time necessary for each maintenance request. Hence, repair time in hours is the dependent variable. Repair time is believed to be related to three factors: the number of months since the last maintenance service, the type of repair problem (mechanical or electrical), and the repairperson who performs the repair (Donna Newton or Bob Jones). Data for a sample of 10 service calls are reported in the following table: Develop the simple linear regression equation to predict repair time given the number of months since the last maintenance service, and use the results to test the hypothesis that no relationship exists between repair time and the number of months since the last maintenance service at the 0.05 level of significance. What is the interpretation of this relationship? What does the coefficient of determination tell you about this model? Using the simple linear regression model developed in part (a), calculate the predicted repair time and residual for each of the 10 repairs in the data. Sort the data in ascending order by value of the residual. Do you see any pattern in the residuals for the two types of repair? Do you see any pattern in the residuals for the two repairpersons? Do these results suggest any potential modifications to your simple linear regression model? Now create a scatter chart with months since last service on the x-axis and repair time in hours on the y-axis for which the points representing electrical and mechanical repairs are shown in different shapes and/or colors. Create a similar scatter chart of months since last service and repair time in hours for which the points representing repairs by Bob Jones and Donna Newton are shown in different shapes and/or colors. Do these charts and the results of your residual analysis suggest the same potential modifications to your simple linear regression model? Create a new dummy variable that is equal to zero if the type of repair is mechanical and one if the type of repair is electrical. Develop the multiple regression equation to predict repair time, given the number of months since the last maintenance service and the type of repair. What are the interpretations of the estimated regression parameters? What does the coefficient of determination tell you about this model? Create a new dummy variable that is equal to zero if the repairperson is Bob Jones and one if the repairperson is Donna Newton. Develop the multiple regression equation to predict repair time, given the number of months since the last maintenance service and the repairperson. What are the interpretations of the estimated regression parameters? What does the coefficient of determination tell you about this model? Develop the multiple regression equation to predict repair time, given the number of months since the last maintenance service, the type of repair, and the repairperson. What are the interpretations of the estimated regression parameters? What does the coefficient of determination tell you about this model? Which of these models would you use? Why?arrow_forward
arrow_back_ios
SEE MORE QUESTIONS
arrow_forward_ios
Recommended textbooks for you
 Financial Reporting, Financial Statement Analysis...FinanceISBN:9781285190907Author:James M. Wahlen, Stephen P. Baginski, Mark BradshawPublisher:Cengage Learning
 Essentials of Business Analytics (MindTap Course ...StatisticsISBN:9781305627734Author:Jeffrey D. Camm, James J. Cochran, Michael J. Fry, Jeffrey W. Ohlmann, David R. AndersonPublisher:Cengage Learning
 Auditing: A Risk Based-Approach to Conducting a Q...AccountingISBN:9781305080577Author:Karla M Johnstone, Audrey A. Gramling, Larry E. RittenbergPublisher:South-Western College Pub
Financial Reporting, Financial Statement Analysis...
Finance
ISBN:9781285190907
Author:James M. Wahlen, Stephen P. Baginski, Mark Bradshaw
Publisher:Cengage Learning
Essentials of Business Analytics (MindTap Course ...
Statistics
ISBN:9781305627734
Author:Jeffrey D. Camm, James J. Cochran, Michael J. Fry, Jeffrey W. Ohlmann, David R. Anderson
Publisher:Cengage Learning
Auditing: A Risk Based-Approach to Conducting a Q...
Accounting
ISBN:9781305080577
Author:Karla M Johnstone, Audrey A. Gramling, Larry E. Rittenberg
Publisher:South-Western College Pub