
Concept explainers
Videos
Marianne Kramer, the owner of Handy Man Rentals, rents carpet cleaners to contractors amid walk-in customers. She is interested in arriving at a
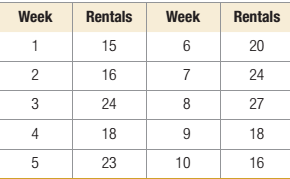
- Prepare a forecast for weeks 6 through 10 by using a 4-week moving average. What is the forecast for week 11?
- Calculate the mean absolute deviation as of the end of week 10.
Want to see the full answer?
Check out a sample textbook solution
Chapter 8 Solutions
Operations Management: Processes and Supply Chains, Student Value Edition Plus MyLab Operations Management with Pearson eText -- Access Card Package (11th Edition)
Additional Business Textbook Solutions
Principles Of Operations Management
Business in Action
Operations and Supply Chain Management 9th edition
Operations Management
OPERATIONS MANAGEMENT IN THE SUPPLY CHAIN: DECISIONS & CASES (Mcgraw-hill Series Operations and Decision Sciences)
Loose-leaf for Operations Management (The Mcgraw-hill Series in Operations and Decision Sciences)


- Under what conditions might a firm use multiple forecasting methods?arrow_forwardThe file P13_42.xlsx contains monthly data on consumer revolving credit (in millions of dollars) through credit unions. a. Use these data to forecast consumer revolving credit through credit unions for the next 12 months. Do it in two ways. First, fit an exponential trend to the series. Second, use Holts method with optimized smoothing constants. b. Which of these two methods appears to provide the best forecasts? Answer by comparing their MAPE values.arrow_forwardThe Baker Company wants to develop a budget to predict how overhead costs vary with activity levels. Management is trying to decide whether direct labor hours (DLH) or units produced is the better measure of activity for the firm. Monthly data for the preceding 24 months appear in the file P13_40.xlsx. Use regression analysis to determine which measure, DLH or Units (or both), should be used for the budget. How would the regression equation be used to obtain the budget for the firms overhead costs?arrow_forward
- The owner of a restaurant in Bloomington, Indiana, has recorded sales data for the past 19 years. He has also recorded data on potentially relevant variables. The data are listed in the file P13_17.xlsx. a. Estimate a simple regression equation involving annual sales (the dependent variable) and the size of the population residing within 10 miles of the restaurant (the explanatory variable). Interpret R-square for this regression. b. Add another explanatory variableannual advertising expendituresto the regression equation in part a. Estimate and interpret this expanded equation. How does the R-square value for this multiple regression equation compare to that of the simple regression equation estimated in part a? Explain any difference between the two R-square values. How can you use the adjusted R-squares for a comparison of the two equations? c. Add one more explanatory variable to the multiple regression equation estimated in part b. In particular, estimate and interpret the coefficients of a multiple regression equation that includes the previous years advertising expenditure. How does the inclusion of this third explanatory variable affect the R-square, compared to the corresponding values for the equation of part b? Explain any changes in this value. What does the adjusted R-square for the new equation tell you?arrow_forwardThe file P13_29.xlsx contains monthly time series data for total U.S. retail sales of building materials (which includes retail sales of building materials, hardware and garden supply stores, and mobile home dealers). a. Is seasonality present in these data? If so, characterize the seasonality pattern. b. Use Winters method to forecast this series with smoothing constants = = 0.1 and = 0.3. Does the forecast series seem to track the seasonal pattern well? What are your forecasts for the next 12 months?arrow_forwardThe file P13_26.xlsx contains the monthly number of airline tickets sold by the CareFree Travel Agency. a. Create a time series chart of the data. Based on what you see, which of the exponential smoothing models do you think will provide the best forecasting model? Why? b. Use simple exponential smoothing to forecast these data, using a smoothing constant of 0.1. c. Repeat part b, but search for the smoothing constant that makes RMSE as small as possible. Does it make much of an improvement over the model in part b?arrow_forward
- Marianne Kramer, the owner of Handy Man Rent-als, rents carpet cleaners to contractors and walk-incustomers. She is interested in arriving at a forecastof rentals so that she can order the correct quantitiesof supplies that go with the cleaners. Data for the last10 weeks are shown here. a. Prepare a forecast for weeks 6 through 10 by using a4-week moving average. What is the forecast for week 11?b. Calculate the mean absolute deviation as of the end ofweek 10.arrow_forwardBased on the following equation for a moving average forecast, what would have been the three week moving average forecast for week 53 for Small Town Restaurant (see downloaded file for actual demand)? Provide two decimal places and use normal rounding. What happens if we increase the time periods in our moving average forecast to six weeks opposed to three? Group of answer choices It would be more accurate because it includes more data. There would be no change. It would be less sensitive to changes. It would be better at predicting a trend.arrow_forward14 Community General Hospital finds itself treating many bicycle accident victims. Data from the last seven 24-hour periods is shown below: Day Bicycle Victims 1 8 2 14 3 8 4 14 5 18 6 15 With an alpha value of 0.31 and a starting forecast in day 3 equal to the 21 , what is the exponentially smoothed forecast for day 4? (Round to two decimal places) 15 What is the exponentially smoothed forecast for day 5? (Round to two decimal places)arrow_forward
- Marianne Schwartz, the owner of Handy Man Rentals, rents carpet cleaners to contractors and walk-in customers. She is interested in arriving at a forecast of rentals so that she can order the correct quantities of supplies that go with the cleaners. Data for the last 10 weeks are shown here. Week 1 2 3 4 8 9 10 Rentals 20 20 34 26 21 12 21 26 19 14 a. Prepare a forecast for weeks 6 through 10 by using a 4-week moving average. (Enter your responses rounded to two decimal places.) Week Forecast 6 25.25 7 23.25 8 20 9 20 10 19.5 What is the forecast for week 11? 20 rentals. (Enter your response rounded to two decimal places.) b. The mean absolute deviation as of the end of week 10 is rentals. (Enter your response rounded to two decimal places.)arrow_forwardHere are the actual tabulated demands for an item for a nine-month period (January through September). Your supervisor wants to test two forecasting methods to see which method was better over this period. MONTH ACTUAL January 120 February 145 March 146 April 171 May 154 June 182 July 138 August 135 September 146 a. Forecast April through September using a three-month moving average. b. Use simple exponential smoothing with an alpha of 0.20 to estimate April through September, using the average of January through March as the initial forecast for April. c-1. Calculate MAD for Three-month moving average and Exponential smoothing. c-2. Use MAD to decide which method produced the better forecast over the six-month period.arrow_forwardThe manager of a travel agency asked you to come up with a forecasting technique that will best fit to the actual demand for packaged tours. You have observed and recorded the actual demand for the last 10 periods. You also identified two possible techniques for consideration: 2-month moving averages (F1), and exponential smoothing (F2) with a smoothing constant of 0.25. Using Cumulative Forecasting Error (CFE) and Mean Absolute Deviation (MAD) as your performance measures you will determine the technique that will best fit to the actual demand data provided in the following table.STEP 1: Given start forecast values in period 3, compute forecast values from period 4 to 10. You are asked to provide the forecast values for period 6 and 10 for both techniques. 2-Month MA Exponential Period Demand F1 F2 1 115 -- -- 2 176 -- -- 3 97 146 129 4 141 5 98 6 132 7 114 8 129 9 107…arrow_forward
 Practical Management ScienceOperations ManagementISBN:9781337406659Author:WINSTON, Wayne L.Publisher:Cengage,
 Contemporary MarketingMarketingISBN:9780357033777Author:Louis E. Boone, David L. KurtzPublisher:Cengage Learning
 MarketingMarketingISBN:9780357033791Author:Pride, William MPublisher:South Western Educational Publishing