
Concept explainers
Videos
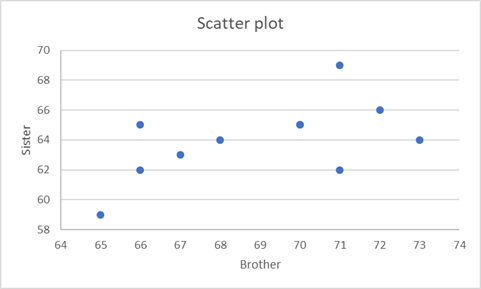
a)
To construct a
a)
Answer to Problem 28E
There is weak
Explanation of Solution
Given:
| Brother | Sister |
| 71 | 69 |
| 68 | 64 |
| 66 | 65 |
| 67 | 63 |
| 70 | 65 |
| 71 | 62 |
| 70 | 65 |
| 73 | 64 |
| 72 | 66 |
| 65 | 59 |
| 66 | 62 |
The scatter plot is,
The
b)
To find the least square regression line.
b)
Answer to Problem 28E
Explanation of Solution
Given:
| Brother | Sister |
| 71 | 69 |
| 68 | 64 |
| 66 | 65 |
| 67 | 63 |
| 70 | 65 |
| 71 | 62 |
| 70 | 65 |
| 73 | 64 |
| 72 | 66 |
| 65 | 59 |
| 66 | 62 |
The least square regression line is,
c)
To interpret slope of the regression equation.
c)
Answer to Problem 28E
On average the height of the sister increases by 0.527 inches per inch of the height of the brother.
Explanation of Solution
Given:
The least square regression line is,
The slope is, b= 0.527
The slope is positive. Therefore, on average the height of the sister increases by 0.527 inches per inch of the height of the brother.
d)
To calculate and interpret the residual for the first pair.
d)
Answer to Problem 28E
we underestimated the height of the sister by 3.9479 inches when making a prediction using the regression line.
Explanation of Solution
Given:
The least square regression line is,
Formula:
Using regression equation, first we find predicted value by replacing
Therefore,
Observed y = 69
Residual can be found as,
This can be interpreted as, we underestimated the height of the sister by 3.9479 inches when making a prediction using the regression line.
Chapter 8 Solutions
PRACTICE OF STATISTICS F/AP EXAM
Additional Math Textbook Solutions
Elementary Statistics
Essentials of Statistics (6th Edition)
Basic Business Statistics, Student Value Edition (13th Edition)
Elementary Statistics (13th Edition)
Statistics for Business and Economics (13th Edition)
Basic Business Statistics, Student Value Edition


 MATLAB: An Introduction with ApplicationsStatisticsISBN:9781119256830Author:Amos GilatPublisher:John Wiley & Sons Inc
 Probability and Statistics for Engineering and th...StatisticsISBN:9781305251809Author:Jay L. DevorePublisher:Cengage Learning
 Statistics for The Behavioral Sciences (MindTap C...StatisticsISBN:9781305504912Author:Frederick J Gravetter, Larry B. WallnauPublisher:Cengage Learning
 Elementary Statistics: Picturing the World (7th E...StatisticsISBN:9780134683416Author:Ron Larson, Betsy FarberPublisher:PEARSON
 The Basic Practice of StatisticsStatisticsISBN:9781319042578Author:David S. Moore, William I. Notz, Michael A. FlignerPublisher:W. H. Freeman
 Introduction to the Practice of StatisticsStatisticsISBN:9781319013387Author:David S. Moore, George P. McCabe, Bruce A. CraigPublisher:W. H. Freeman