Preliminary data analyses indicate that you can reasonably apply the z-interval procedure (Procedure 8.1 on page 339) in Exercises 8.69–8.74 . 8.69 Venture - Capital Investments. Data on investments in the high-tech industry by venture capitalists are compiled by VentureOneCorporation and published in America’s Network Telecom Investor Supplement. A random sample of 18 venture-capital investments in the fiber optics business sector yielded the following data, in millions of dollars. Determine and interpret a 95% confidence interval for the mean amount, μ, of all venture-capital investments in the fiber optics business sector. Assume that the population standard deviation is $2.04 million. (Note: The sum of the data is $113.97 million.)
Preliminary data analyses indicate that you can reasonably apply the z-interval procedure (Procedure 8.1 on page 339) in Exercises 8.69–8.74 . 8.69 Venture - Capital Investments. Data on investments in the high-tech industry by venture capitalists are compiled by VentureOneCorporation and published in America’s Network Telecom Investor Supplement. A random sample of 18 venture-capital investments in the fiber optics business sector yielded the following data, in millions of dollars. Determine and interpret a 95% confidence interval for the mean amount, μ, of all venture-capital investments in the fiber optics business sector. Assume that the population standard deviation is $2.04 million. (Note: The sum of the data is $113.97 million.)
Solution Summary: The author analyzes the 95% confidence interval of the population mean amount of investments for 18 randomly selected venture capital investments in the fiber optics business sector.
Preliminary data analyses indicate that you can reasonably apply the z-interval procedure (Procedure 8.1 on page 339) in Exercises 8.69–8.74.
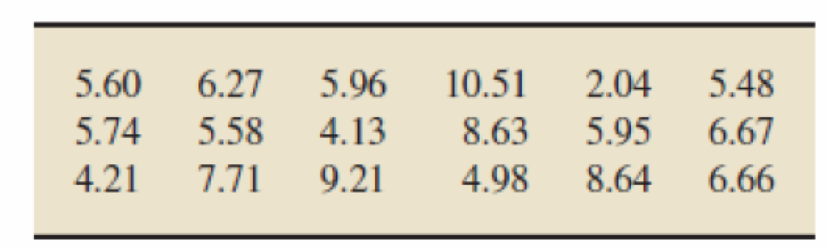
8.69 Venture-Capital Investments. Data on investments in the high-tech industry by venture capitalists are compiled by VentureOneCorporation and published in America’s Network Telecom Investor Supplement. A random sample of 18 venture-capital investments in the fiber optics business sector yielded the following data, in millions of dollars.
Determine and interpret a 95% confidence interval for the mean amount, μ, of all venture-capital investments in the fiber optics business sector. Assume that the population standard deviation is $2.04 million. (Note: The sum of the data is $113.97 million.)
The table below summarizes a data set we first encountered in Exercise 6.29 that examines the responses of a random sample of college graduates and nongraduates on the topic of oil drilling. Complete a chi-square test for these data to check whether there is a statistically significant difference in responses from college graduates and non-graduates.
χ2:?
df:?
Conclusion:
There is insufficient evidence that there is an association between support for off-shore drilling and having a college degree
There is strong evidence that the proportion of those supporting off-shore drilling is greater than those having a college degree
There is insufficient evidence that the proportion of those supporting off-shore drilling is greater than those having a college degree
There is strong evidence that there is an association between support for off-shore drilling and having a college degree
An official of a large car manufacturing company wanted to study the relationship between an employee's age and the number of absences. For this, a random sample of 10 randomly selected employees was collected and the following data was obtained.
The material:
age
40
28
34
27
21
38
19
55
31
35
number of absences
1
6
6
9
12
4
13
2
5
3
(a) Predict the number of absenteeism for a 42-year-old employee.(b) Determine the 95% prediction interval for the number of absences for the employee in (a).
A Canadian study measuring depression level in teens (as reported in the Journal of Adolescence, vol. 25, 2002) randomly sampled 112 male teens and 101 female teens, and scored them on a common depression scale (higher score representing more depression). The researchers suspected that the mean depression score for male teens is higher than for female teens, and wanted to check whether data would support this hypothesis.
What conclusion can you draw from the output?
The data provide sufficient evidence to reject H0 and to conclude that the mean depression score for male teens is larger than that of female teens.
The data provide sufficient evidence to conclude that male and female teens do not differ in mean depression score.
The data do not provide sufficient evidence to conclude that the mean depression score of male teens is larger than that of female teens.
The data do not provide sufficient evidence to reject H0, so we accept it, and conclude that male and female teens do…
Need a deep-dive on the concept behind this application? Look no further. Learn more about this topic, statistics and related others by exploring similar questions and additional content below.
Hypothesis Testing and Confidence Intervals (FRM Part 1 – Book 2 – Chapter 5); Author: Analystprep;https://www.youtube.com/watch?v=vth3yZIUlGQ;License: Standard YouTube License, CC-BY


 Glencoe Algebra 1, Student Edition, 9780079039897...AlgebraISBN:9780079039897Author:CarterPublisher:McGraw Hill