
Videos
Preliminary data analyses indicate that you can reasonably apply the z-interval procedure (Procedure 8.1 on page 339) in Exercises 8.69–8.74.
8.70 Poverty and Dietary Calcium. Calcium is the most abundant mineral in the human body and has several important
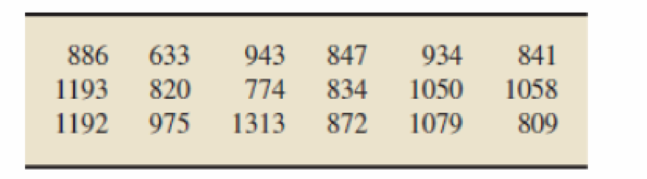
Determine and interpret a 95% confidence interval for the mean calcium intake, μ, of all adults with incomes below the poverty level. Assume that the population standard deviation is 188 mg. (Note: The sum of the data is 17,053 mg.)
Want to see the full answer?
Check out a sample textbook solution
Chapter 8 Solutions
Introductory Statistics (10th Edition)


- A Canadian study measuring depression level in teens (as reported in the Journal of Adolescence, vol. 25, 2002) randomly sampled 112 male teens and 101 female teens, and scored them on a common depression scale (higher score representing more depression). The researchers suspected that the mean depression score for male teens is higher than for female teens, and wanted to check whether data would support this hypothesis. What conclusion can you draw from the output? The data provide sufficient evidence to reject H0 and to conclude that the mean depression score for male teens is larger than that of female teens. The data provide sufficient evidence to conclude that male and female teens do not differ in mean depression score. The data do not provide sufficient evidence to conclude that the mean depression score of male teens is larger than that of female teens. The data do not provide sufficient evidence to reject H0, so we accept it, and conclude that male and female teens do…arrow_forwardThe new version of the Standard requires the measurement uncertainty (MU) contributions of sampling to be considered Comment on whether this is still applicable if the facility is not accredited for sampling or is not responsible for sampling.arrow_forwardResearchers at a medical school want to compare the rates of birth defects in babies born to mothers with low-fat diets with those born to mothers with high-fat diets. For one year, they collected data on all babies and their mothers in area hospitals, using information obtained from the mothers to determine whether they fall in the low fat or high fat diet category.A) Observational B) Experimentalarrow_forward
- An automobile manufacturer who wishes to advertise that one of its models achieves 30 mpg (miles per gallon) decides to carry out a fuel efficiency test. Six nonprofessional drivers were selected, and each one drove a car from Phoenix to Los Angeles. The resulting fuel efficiencies (in miles per gallon) are given below. 27.2 29.2 31.2 28.5 30.3 29.5 Assuming that fuel efficiency is normally distributed under these circumstances, do the data contradict the claim that true average fuel efficiency is (at least) 30 mpg? Test the appropriate hypotheses at significance level 0.05. (Use a statistical computer package to calculate the P-value. Round your test statistic to two decimal places and your P-value to three decimal places.) t= P-value = State the conclusion in the problem context. Reject H0. We have convincing evidence that the mean fuel efficiency under these circumstances is less than 30 miles per gallon.Do not reject H0. We have convincing evidence that the mean fuel…arrow_forwardIn an ABA design, the second stage is used to: reduce the chance that fatigue effects will occur manipulate the independent variable measure the effect of the dependent variable establish a baselinearrow_forwardDoes the data need to be normally distributed for a t-test to work?arrow_forward
- Suppose a study reported that the average persin watched 3.37 hours of television per day. a random sample of 15 people gave the number of hours of television watched per day shown below. at the 1% significance level, do the data provide sufficent evidence to conclude that the amount of television watched per day last year by the average person is greater than the value reported in the study? A.select the correct parameter. a.the average number of hours that all people watch tv b. the average number of hours that the 15 people watch tv c. the fraction of hours people watch tv d. the total number of hours that a person watches tv B. select the correct hypotheses: a. Ho: mu= 3.37 Ha: mu is greater than 3.37 b. Ho: mu=4.103 Ha: mu is greater than 4.103 c.Ho: p=3.37 Ha: p is less than 3.37 d.Ho: mu=3.37 Ha: mu is less than 3.37 C. which of following statements best describes the sampling distribution? a. the sampling distribution is normal with mean 3.37 hours and standard deviation…arrow_forwardA park ranger takes a sample of 15 national park patrons and measures their attitudes about a new park to make inferences about national park patrons in general. What is the population that the park ranger is interested in studying? When the park ranger has computed the sample’s average attitude score, is this a statistic or a parameter? Why?arrow_forwardA researcher was interested in studying the best way to teach suturing and casting to surgicalresidents. To study this, all incoming orthopaedic residents were divided into three groups: astandard training group scheduled to work in the emergency department (n=8), an instructor-led surgical skills boot camp group (n=8), and student-led surgical skills boot camp group (n=8).After 7 days of the intervention, suturing and casting skills were measured through asimulation-based exam. The researcher wants to know whether average exam scores differbetween the three groups. Under the heading “Results” present your findings (i.e., what you found).Include at least one measure of central tendency and variability. An assumption check(describe what you did and what you found, as needed), check for potential outliers,and present the findings of your inferential test (i.e., your critical value and p value), asappropriate. Participant Average Exam Score (%) Intervention 1 50 On service 2 60 On…arrow_forward
- 1.To determine which of the two models above – BIG or small – is statistically superior at the .05 level, please calculate the appropriate F-statistic (4 decimal places). 2. How many degrees of freedom are there?arrow_forwardA survey of 28 employed workers found that the correlation coefficient between the number of years of post-secondary education and current annual income in dollars is -0.38. The researchers hypothesize a positive relationship between number of years of post-secondary education and annual income. What can the researchers conclude with α = 0.05? a) Obtain/compute the appropriate values to make a decision about H0. critical value= test statistic= b) effect size= C) 1)There is a significant positive relationship between years of post-secondary education and current annual income. 2)There is a significant negative relationship between years of post-secondary education and current annual income. 3) There is no significant relationship between years of post-secondary education and current annual income.arrow_forwardtwo types of preoperative skin preparation before performing open heart surgery. These two preparations used aqueous iodine and insoluble iodine. Do these data provide sufficient evidence at the α = 0.05 level to justify the conclusion that they type of skin preparation and infection are associated?arrow_forward
 MATLAB: An Introduction with ApplicationsStatisticsISBN:9781119256830Author:Amos GilatPublisher:John Wiley & Sons Inc
 Probability and Statistics for Engineering and th...StatisticsISBN:9781305251809Author:Jay L. DevorePublisher:Cengage Learning
 Statistics for The Behavioral Sciences (MindTap C...StatisticsISBN:9781305504912Author:Frederick J Gravetter, Larry B. WallnauPublisher:Cengage Learning
 Elementary Statistics: Picturing the World (7th E...StatisticsISBN:9780134683416Author:Ron Larson, Betsy FarberPublisher:PEARSON
 The Basic Practice of StatisticsStatisticsISBN:9781319042578Author:David S. Moore, William I. Notz, Michael A. FlignerPublisher:W. H. Freeman
 Introduction to the Practice of StatisticsStatisticsISBN:9781319013387Author:David S. Moore, George P. McCabe, Bruce A. CraigPublisher:W. H. Freeman