
Concept explainers
Videos
Shared leadership in airplane crews. Human Factors (March 2014) published a study that examined the effect of shared leadership by the cockpit and cabin crews of a commercial airplane. Simulated flights were taken by 84 six-person crews, where each crew consisted of a two-person cockpit (captain and first officer) and a four-person cabin team (three flight attendants and a purser.) During the simulation, smoke appeared in the cabin and the reactions of the crew were monitored for teamwork. Each crew was rated as working either successfully or unsuccessfully as a team. Also, each individual member was evaluated for leadership (measured as number of leadership
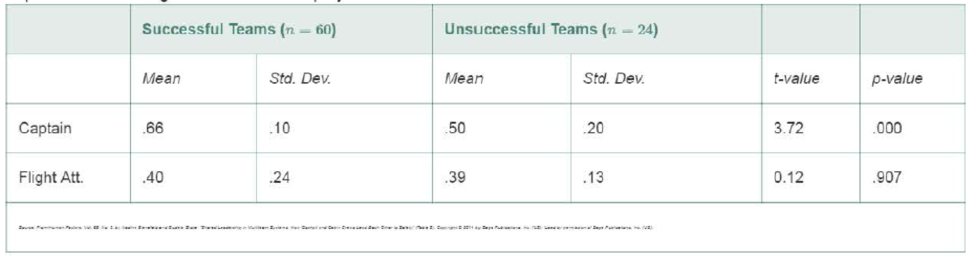
- a. Consider the data for captains. Interpret the p-value for testing (at α = .05) whether the mean leadership values for captains from successful and unsuccessful teams differ.
- b. Consider the data for flight attendants. Interpret the p-value for testing (at α = .05) whether the mean leadership values for flight attendants from successful and unsuccessful teams differ.
Want to see the full answer?
Check out a sample textbook solution
Chapter 8 Solutions
Statistics For Business And Economics Plus Mystatlab With Pearson Etext -- Access Card Package (13th Edition)


- What is an experiment?arrow_forwardIn studies examining the effect of humor on interpersonal attractions, McGee and Shevlin (2009) found that an individual’s sense of humor had a significant effect on how the individual was perceived by others. In one part of the study, female college students were given brief descriptions of a potential romantic partner. The fictitious male was described positively as being single and ambitious and having good job prospects. For one group of participants, the description also said that he had a great sense of humor. For another group, it said that he has no sense of humor. After reading the description, each participant was asked to rate the attractiveness of the man on a seven-point scale from 1 (very unattractive) to 7 (very attractive). A score of 4 indicates a neutral rating. The females who read the “great sense of humor” description gave the potential partner an average attractiveness score of M = 4.53 with a standard deviation of s = 1.04. If the sample consisted of n = 16…arrow_forwardHospital re-admissions for patients with congestive heart failure (CHF) are relatively common and costly occurrences within the U.S. health infrastructure, including the Veterans Affairs (VA) healthcare system. Little is known about CHF re-admissions among rural veteran patients, including the effects of socio-demographics and follow-up outpatient visits on these re-admissions. Purpose: To examine socio-demographics of U.S. veterans with CHF who had 30 day potentially preventable re-admissions and compare the effect of 30 days VA post-discharge service use on these re-admissions for rural- and urban-dwelling veterans. (muus, Knedson, Klug, Gokun, Sarrazin, & Kaboli, 2010). 30 Day Re-admission Location of Residence Yes No Urban 17,872 3,792 Rural 9,428 1,906 When comparing the rates of re-admission for urban versus rural veterans, the authors obtained a p-value of 0.921 from a chi-square test of independence. What does this…arrow_forward
- Hospital re-admissions for patients with congestive heart failure (CHF) are relatively common and costly occurrences within the U.S. health infrastructure, including the Veterans Affairs (VA) healthcare system. Little is known about CHF re-admissions among rural veteran patients, including the effects of socio-demographics and follow-up outpatient visits on these re-admissions. Purpose: To examine socio-demographics of U.S. veterans with CHF who had 30 day potentially preventable re-admissions and compare the effect of 30 days VA post-discharge service use on these re-admissions for rural- and urban-dwelling veterans. (muus, Knedson, Klug, Gokun, Sarrazin, & Kaboli, 2010). 30 Day Re-admission Location of Residence Yes No Urban 17,872 3,792 Rural 9,428 1,906 The authors want to investigate re-admission rates for two-cohorts (urban and rural residence). Based on the information in the preceding table, create a table that provides…arrow_forwardA study (Journal of Family Practice 2000; 50:138-144) with 233 low-income adult smokers evaluated the effectiveness of usual care (physician advice and follow-up) for smokers wishing to quit to the usual care enhanced by computer-assisted telephone counseling sessions. Each subject was assigned randomly either to the usual care or to the usual care plus counseling, and their smoking status (still smoking or quit smoking) was observed after 3 months. The percentage who had quit smoking was higher for the group receiving counseling. (a) Identify the response variable and the explanatory variable. Response: ---Select--- type of care income level quit smoking or not time until quit smoking Explanatory: ---Select--- type of care income level quit smoking or not time until quit smoking (b) Is this study an observational study or an experiment? Explain. Observational study. Smokers were not randomly assigned to care groups. Observational study. Smokers were randomly…arrow_forwardMcAllister et al. (2012) compared varsity football and hockey players with varsity athletes from non-contact sports to determine whether exposure to head impacts during one season have an effect on cognitive performance. In the study, tests of new learning performance were significantly poorer for the contact sport athletes compared to the non-contact sport athletes. Cognitive Performance Contact Athletes Non-Contact Athletes n1 = 8 n2 = 8 M1 = 6 M2 = 9 s2 = 8 s2 = 6.23 Are the test scores significantly lower for the contact sport athletes than for the non-contact athletes? Conduct the appropriate hypothesis test using α = .05 and state your conclusion in terms of this problem. Make sure to use APA style conclusions (as shown in lecture videos).arrow_forward
- In the book Business Research Methods (5th ed.), Donald R. Cooper and C. William Emory discuss studying the relationship between on-the-job accidents and smoking. Cooper and Emory describe the study as follows: Suppose a manager implementing a smoke-free workplace policy is interested in whether smoking affects worker accidents. Since the company has complete reports of on-the-job accidents, she draws a sample of names of workers who were involved in accidents during the last year. A similar sample from among workers who had no reported accidents in the last year is drawn. She interviews members of both groups to determine if they are smokers or not. The sample results are given in the following table. On-the-Job Accident Smoker Yes No Row Total Heavy 12 5 17 Moderate 9 10 19 Nonsmoker 13 17 30 Column total 34 32 66 Expected counts are below observed counts Accident No Accident Total Heavy 12 5 17 8.76 8.24…arrow_forwardDo cell phones increase drivers' reaction times while driving? A 2003 American Journal of Health Education study investigated the effects of cell phone use on reaction time. In the study, 60 participants were randomly selected and placed into one of two groups: the cell phone group or the control group. Those in the control group participated in the experiment with no distractions, whereas those in the cell phone group had access to text documents on a cell phone. Participants in each group were then asked to take a computerized reaction time test. Researchers then recorded each subject's reaction time in seconds. The table shows the results of the experiment. Group Populationmean Samplesize Samplemean Sample standarddeviation Phone up n=30 x¯P=0.546 sx=0.213 Control uc n=30 x¯C=0.356 sx=0.245 df=56.900 Suppose the researchers wish to examine at a significance level of alpha=0.05 if the mean reaction time for phone users is larger than the mean reaction time for the…arrow_forwardA cross-sectional study is conducted to investigate cardiovascular disease (CVD) risk factors among a sample of patients seeking medical care at one of three local hospitals. A total of 500500 patients are enrolled. Based on the following data, we would like to determine if there is a significant association between the family history of CVD and the enrollment site. Enrollment Site Family History of CVD Hospital 1 Hospital 2 Hospital 3 Total Yes 34 8 58 100 No 104 72 224 400 Total 138 80 282 500 Given: The value of the test statistic is χ2= 6.912 Use α=0.1 as the level of significance. The superintendent of Hospital 2 performed the Goodness of Fit Test to test whether 25% of the patients go to Hospital 1, 15% of the patients go to Hospital 2 and 60% of the patients go to Hospital 3. Given: The superintendent found that the pp-value for the test is 0.25091 Let: p1=p1= be the proportion of patients at Hospital 1 p2=p2= be the proportion of patients at…arrow_forward
- A group of psychologists recently examined the how odor influences emotion between male and female. Three groups of participants (half male, half female) were first subjected to different types of smell (pleasant, neutral, and unpleasant), and then filled out questionnaire of happiness. The data present the pattern of results obtained in the study, with higher scores indicating a higher level of happiness Odor pleasant neutral unpleasant Male n = 5 n = 5 n = 5 M = 8 M = 7 M = 0 SS = 6 SS = 5 SS = 4 Female n = 5 n = 5 n = 5 M = 7 M =2 M = 0 SS = 6 SS = 4 SS = 6 Note: grand mean =4 A) Conduct a hypotheses testing with α = .05 to evaluate the main effects and interactions (follow the four-step procedure). B) Calculate the effect size (partial η2) for the main effects and the interaction. C) Plot the cell means in a graph, with odor type on the x-axis. D) Based on the pattern of interaction shown in the graph,…arrow_forwardAs an admissions counselor, I am interested in understanding whether or not there is a difference in stress levels not only between different majors but also between different classes (Freshman v. Seniors). I gather the following data from students from three majors (Psychology, Chemistry, and Engineering), that are in their freshmen or senior years and ask them about their stress levels (scale of 1-10, with lower numbers meaning less stress). Using the data below, test whether there are effects of class, major, or an interaction between them at an alpha of 0.05. Psychology Chemistry Engineering Freshmen 3, 4, 4, 2, 4 4, 5, 7, 8, 4 5, 7, 7, 8, 5 Senior 4, 5, 5, 3, 5 8, 5, 6, 7, 7 9, 9, 8, 7, 9 What is the critical F value for major? ___________ What is the critical F value for class? ___________ What is the critical F value for the interaction between major and class? ___________arrow_forwardAs an admissions counselor, I am interested in understanding whether or not there is a difference in stress levels not only between different majors but also between different classes (Freshman v. Seniors). I gather the following data from students from three majors (Psychology, Chemistry, and Engineering), that are in their freshmen or senior years and ask them about their stress levels (scale of 1-10, with lower numbers meaning less stress). Using the data below, test whether there are effects of class, major, or an interaction between them at an alpha of 0.05. Psychology Chemistry Engineering Freshmen 3, 4, 4, 2, 4 4, 5, 7, 8, 4 5, 7, 7, 8, 5 Senior 4, 5, 5, 3, 5 8, 5, 6, 7, 7 9, 9, 8, 7, 9 Complete the ANOVA summary table below: Source SS df MS (variance) F MAJOR CLASS MAJOR*CLASS ERROR/RESIDUAL Nothing here TOTAL Nothing here Nothing here What can we conclude?…arrow_forward
 Glencoe Algebra 1, Student Edition, 9780079039897...AlgebraISBN:9780079039897Author:CarterPublisher:McGraw Hill
 Big Ideas Math A Bridge To Success Algebra 1: Stu...AlgebraISBN:9781680331141Author:HOUGHTON MIFFLIN HARCOURTPublisher:Houghton Mifflin Harcourt
 Holt Mcdougal Larson Pre-algebra: Student Edition...AlgebraISBN:9780547587776Author:HOLT MCDOUGALPublisher:HOLT MCDOUGAL