
Concept explainers
Videos
a.
Compute the sample proportion
a.
Answer to Problem 10E
The value of sample proportion
Explanation of Solution
In a simple random sample, of 60 samples, only 38 individuals are in the group of interest.
The sample proportion
Where, x be the number of observations, n be the sample size.
Substitute the corresponding values to get the proportion,
Thus, the sample proportion
b.
Check whether the assumptions for the hypothesis test are satisfied.
b.
Answer to Problem 10E
Yes, the assumptions for the hypothesis test are satisfied.
Explanation of Solution
Assumptions for performing a hypothesis test for a population proportion:
- The samples taken from the population are simple random samples.
- The population is at least 20 times as large as the sample.
- The samples in the population are divided into two categories.
- The values of
Requirement check:
- The sample of 60 is simple random samples.
- The information about the population is not known. The population size is assumed to be more than 20 times as large as the sample.
- The samples in the population seemed to be categorized into two parts. That is, individuals under category of interest and individuals not under the category of interest.
- Verify the condition:
Substitute n as 60 and
Substitute n as 60 and
Therefore, all the conditions are satisfied.
c.
Find the value of test statistic.
c.
Answer to Problem 10E
The value of test statistic is –1.13.
Explanation of Solution
Calculation:
Denote p as the true population proportion.
The given test hypotheses are:
Null hypothesis:
That is, the true proportion of the individuals under the category of interest is 0.7.
Alternate hypothesis:
That is, the true proportion of the individuals under the category of interest is different from 0.7.
Test statistic:
The z-test statistic is:
Where,
Software procedure:
Step by step procedure to find the test statistic using the MINITAB software:
- Choose Stat > Basic Statistics > 1-Proportion.
- In Number of trials, enter the Sample size as 60 and in Number of
Events , Enter Number of observations as 38. - Enter Hypothesized proportion as 0.7.
- Select Options.
- Choose
- Click OK in all dialogue boxes.
The output using Minitab is given below:
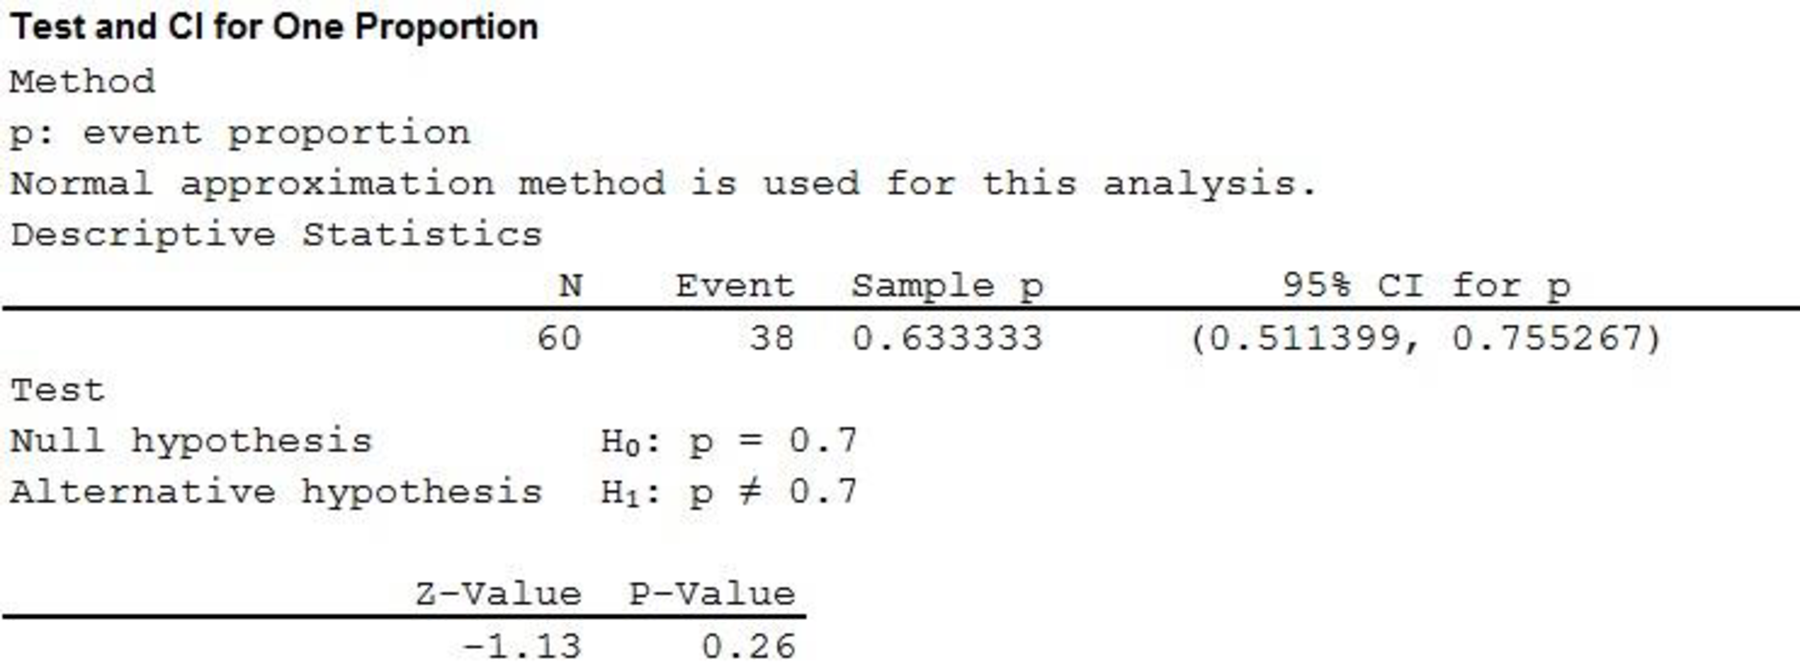
From the MINITAB output, the test statistic, that is, the z-value is –1.13.
Thus, the value of test statistic z is –1.13.
d.
Decide whether the null hypothesis
d.
Answer to Problem 10E
The null hypothesis
Explanation of Solution
From previous part (c), it has been found that the value of test statistic z is –1.13.
From the given hypothesis, the alternative hypothesis contains the not equal
From Table 8.1 “Table of Critical Values”, the critical value for two-tailed test at
Therefore, the critical region is
Decision based on the critical value method:
For left-tailed test: If
For right-tailed test: If
For two-tailed test: If
Conclusion:
The critical value at
Here, the test statistic value of –2.80 lies within the critical region of
That is,
Therefore, the null hypothesis is not rejected.
Hence, there is no evidence that the true proportion of the individuals under the category of interest is 0.7.
Want to see more full solutions like this?
Chapter 8 Solutions
Essential Statistics


- A ferry will safely accommodate 86 tons of passenger cars. Assume that the mean weight of a passenger car is 2.1 tons with standard deviation 0.6 tons. If a random sample of 38 cars are loaded onto the ferry, what is the probability that the maximum safe weight will be exceeded?arrow_forwardAccording to a survey, the average American person is in a car for 5 hours per week. To test if the amount of car time in Los Angeles is less than the national average, a researcher decides to do a hypothesis test, at a 10% significance level. She surveys 15 Los Angeleans randomly and asks them about their amount of time in a car each week, on average. From the data, the sample mean time is 4.3 hours per week, and the sample standard deviation (s) is 0.7 hours. H0: μ≤5; Ha: μ>5. α=0.1 (significance level) What is the test statistic (t-value) of this one-mean hypothesis test (with σ unknown)? Round your final answer to two decimal places.arrow_forwardIn a survey of 703 randomly selected workers, 61% got their jobs through networking (based on data from Taylor Nelson Sofres Research). Use the sample data with a 0.05 significance level to test the claim that most (more than 50%) workers get their jobs through networking. What does the result suggest about the strategy for finding a job after graduation? A sample of 106 body temperatures was found to have a mean of 98.20℉ and a standard deviation of 0.62℉. Use a 0.05 significance level to test the claim that the mean body temperature of the population is equal to 98.6℉ as is commonly believed. Is there sufficient evidence to conclude that the common belief is wrong?arrow_forward
- A random sample of 200 television programs contained an average of 5.25 acts of physical violenceper program, with a standard deviation of 0.28. At the 99% confidence level, what is your estimateof the population mean?arrow_forwardA researcher claims that the average wind speed in a certain city is 8 miles per hour. A sample of 32 days has an average wind speed of 8.2 miles per hour. The population standard deviation for this city’s wind speed is 0.6 miles per hour. At a significance level of 0.05, what is the p-value for this hypothesis test?arrow_forwardThe average monthly earnings for women in managerial and professional positions is P40,000. Do men in the same position have an average monthly earnings that are higher than those for women? A random sample of 40 men in managerial and professional positions showed a mean of P53,000 and standard deviation of P4,000. Test the appropriate hypothesis using 1% level of significance.arrow_forward
- With a population standard deviation of 48, it is known on average that 39% of Chinese people are willing to be vaccinated. A survey was conducted among 30 Chinese people regarding their willingness to be vaccinated. Based on the result, all 30 respondents were willing. Using a 5% level of significance, conduct the four-step model for hypothesis testing (State the hypotheses, Select the alpha level (level of significance), Compute the test statistic, Interpret the result).arrow_forwardA business consulting firm took a sample of 100 customers from the Standard Bank and found that they waited an average of 4.5 minutes before being served. Another sample of 200 customers taken from the Public Bank showed that these customers waited an average of 4.75 minutes before being served. Assume that the standard deviations for the two populations are 1.2 and 1.5 minutes, respectively. Suppose you must test the hypothesis at 5% significance level whether the claim of the management of the Standard Bank is true. Determine (i) the alternative hypothesis to be tested: (ii) the value of test statistic: (iii) the p-value and the conclusion.arrow_forwardHistorically, evening long-distance calls from a particular city have averaged 15.1 minutes per call. In a random sample of 37 calls, the sample mean time was 13.3 minutes. Assume the standard deviation is known to be 5 minutes. Using a 0.05 level of significance, is there sufficient evidence to conclude that the average evening long-distance call has decreased?arrow_forward
- A sample of 80 University night school students' ages was obtained in order to estimate the mean age of all night school students. The sample mean was 25.1 years, with a sample variance of 16.2. a. Give the point estimate for µ, the population mean, along with the margin of error. b. Calculate the 99% confidence interval for µ.arrow_forwardWe want to determine the contribution of a new exercise program on sleep time among children. For a sample of 11 randomly selected children from a normally distributed population, we measure nightly sleep time (in hours) both before and after the implementation of the new exercise program. The mean difference in sleep time (between pre- and post-program measurements) is 0.65 hours with a standard deviation of 1.1 hours. Using the significance level α = .05, test the claim that there is a statistically significant difference in nightly sleep time between pre-program and post-program measurementsarrow_forwardA manufacturer must test that his bolts are 3.00 cm long when they come off an assembly line. He must recalibrate his machines if the bolts are too long or too short. After sampling 169 randomly selected bolts off the assembly line, he calculates the sample mean to be 3.17 cm. He knows that the population standard deviation is 0.86 cm. Assuming a level of significance is 0.5, is there significant evidence to show that the manufacturer needs to recalibrate the machine? State the null and alternative hypothesis for the testsarrow_forward
 MATLAB: An Introduction with ApplicationsStatisticsISBN:9781119256830Author:Amos GilatPublisher:John Wiley & Sons Inc
 Probability and Statistics for Engineering and th...StatisticsISBN:9781305251809Author:Jay L. DevorePublisher:Cengage Learning
 Statistics for The Behavioral Sciences (MindTap C...StatisticsISBN:9781305504912Author:Frederick J Gravetter, Larry B. WallnauPublisher:Cengage Learning
 Elementary Statistics: Picturing the World (7th E...StatisticsISBN:9780134683416Author:Ron Larson, Betsy FarberPublisher:PEARSON
 The Basic Practice of StatisticsStatisticsISBN:9781319042578Author:David S. Moore, William I. Notz, Michael A. FlignerPublisher:W. H. Freeman
 Introduction to the Practice of StatisticsStatisticsISBN:9781319013387Author:David S. Moore, George P. McCabe, Bruce A. CraigPublisher:W. H. Freeman