Elementary Statistics: A Step By Step Approach
9th Edition
ISBN: 9780073534985
Author: Allan Bluman
Publisher: McGraw-Hill Science/Engineering/Math
bartleby

Videos

Question
Book Icon
Chapter 9, Problem 18CQ

a.

To determine

To identify: The claim and state H0 and Ha .

a.

Expert Solution
Check Mark

Answer to Problem 18CQ

The claim is that “there is a significant difference between the two states in chemists’ salaries”.

The hypotheses are given below:

Null hypothesis: H0:μ1=μ2

Alternative hypothesis: H1:μ1μ2 (claim)

Explanation of Solution

Given info:

Elementary Statistics: A Step By Step Approach, Chapter 9, Problem 18CQ , additional homework tip  1

x¯1=$39,420 , x¯2=$30,215 , s1=$1,659 , s2=$4,116 , n1=12 , and n2=26

Justification:

Here, there is a significant difference between the two states in chemists’ salaries is tested. Hence, the claim is that there is a significant difference between the two states in chemists’ salaries. This can be written as μ1μ2 . The complement of the claim is μ1=μ2 . In the given experiment, the alternative hypothesis indicates the claim.

The hypotheses are given below:

Null hypothesis:

H0:μ1=μ2

Alternative hypothesis:

H1:μ1μ2

b.

To determine

To find: The critical value α=0.02 .

b.

Expert Solution
Check Mark

Answer to Problem 18CQ

The critical value at α=0.02 is ±2.718 .

Explanation of Solution

Calculation:

Here, the test is two tailed test.

Critical value:

Here, variances are not equal. Hence, the degrees of freedom is,

df=Smallar of n11 and  n21=121=11

Software Procedure:

Step-by-step procedure to obtain the critical value using the MINITAB software:

  • Choose Graph > Probability Distribution Plot choose View Probability> OK.
  • From Distribution, choose ‘t’ distribution.
  • In Degrees of freedom, enter 11.
  • Click the Shaded Area tab.
  • Choose Probability value and Two Tail for the region of the curve to shade.
  • Enter the Probability value as 0.02.
  • Click OK.

Output using the MINITAB software is given below:

Elementary Statistics: A Step By Step Approach, Chapter 9, Problem 18CQ , additional homework tip  2

From the output, the critical value is ±2.718 .

c.

To determine

To find: The test value.

c.

Expert Solution
Check Mark

Answer to Problem 18CQ

The test value is 9.81.

Explanation of Solution

Calculation:

Test statistic:

Software Procedure:

Step by step procedure to obtain test statistic using the MINITAB software:

  • Choose Stat > Basic Statistics > 2-Sample t.
  • Choose Summarized data.
  • In first, enter Sample size as 12, Mean as 39,420, Standard deviation as 1,659.
  • In second, enter Sample size as26, Mean as 30,215, Standard deviation as 4,116.
  • Choose Options.
  • In Confidence level, enter 98.
  • In Alternative, select not equal.
  • Click OK in all the dialogue boxes.

Output using the MINITAB software is given below:

Elementary Statistics: A Step By Step Approach, Chapter 9, Problem 18CQ , additional homework tip  3

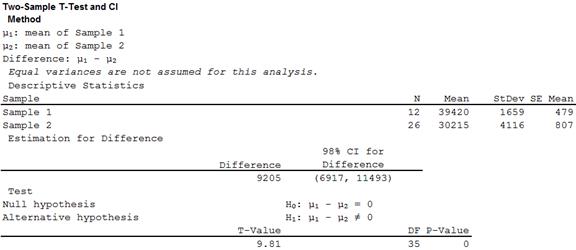
From the MINITAB output, the test value is 9.81.

d.

To determine

To make: The decision.

d.

Expert Solution
Check Mark

Answer to Problem 18CQ

The decision is that, the null hypothesis isrejected.

Explanation of Solution

Calculation:

Software Procedure:

Step-by-step procedure to indicate the appropriate area and critical value using the MINITAB software:

  • Choose Graph > Probability Distribution Plot choose View Probability> OK.
  • From Distribution, choose ‘t’ distribution.
  • In Degrees of freedom, enter 11.
  • Click the Shaded Area tab.
  • Choose Probability value and Two Tail for the region of the curve to shade.
  • Enter the Probability value as 0.02.
  • Enter 9.81 under show reference lines at X values
  • Click OK.

Output using the MINITAB software is given below:

Elementary Statistics: A Step By Step Approach, Chapter 9, Problem 18CQ , additional homework tip  4

From the output, it can be observed that the test statistic value falls in the critical region. Therefore, the null hypothesis isrejected.

e.

To determine

To summarize: The result.

To construct: The 99% confidence interval for the difference of the mean.

e.

Expert Solution
Check Mark

Answer to Problem 18CQ

The conclusion is that, there is enough evidence to support the claim that there is a significant difference between the two states in chemists’ salaries.

The 98% confidence interval for the difference of the mean is ($6,917,$11,493) .

Explanation of Solution

Justification:

From part (d), the null hypothesis is rejected. Thus, there is enough evidence to support the claim that there is a significant difference between the two states in chemists’ salaries.

Confidence interval:

From the MINITAB output in part (c), the 98% confidence interval for the difference of the mean is ($6,917,$11,493) .

Want to see more full solutions like this?

Subscribe now to access step-by-step solutions to millions of textbook problems written by subject matter experts!

Chapter 9 Solutions

Elementary Statistics: A Step By Step Approach

Ch. 9.1 - For Exercises 5 through 16, perform each of the...Ch. 9.1 - Prob. 11ECh. 9.1 - For Exercises 5 through 16, perform each of the...Ch. 9.1 - Prob. 13ECh. 9.1 - For Exercises 5 through 16, perform each of the...Ch. 9.1 - Self-Esteem Scores In a study of a group of women...Ch. 9.1 - Ages of College Students The dean of students...Ch. 9.1 - Prob. 17ECh. 9.1 - Prob. 18ECh. 9.1 - Prob. 19ECh. 9.1 - Prob. 20ECh. 9.1 - Television Watching The average number of hours of...Ch. 9.1 - For Exercises 5 through 16, perform each of the...Ch. 9.1 - Prob. 23ECh. 9.1 - Home Prices According to the almanac, the average...Ch. 9.1 - Exam Scores at Private and Public Schools A...Ch. 9.1 - Sale Prices for Houses The average sales price of...Ch. 9.1 - Average Earnings for College Graduates The average...Ch. 9.2 - Too Long on the Telephone A company collects data...Ch. 9.2 - Prob. 1ECh. 9.2 - For these exercises, perform each of these steps....Ch. 9.2 - Prob. 3ECh. 9.2 - Prob. 4ECh. 9.2 - For these exercises, perform each of these steps....Ch. 9.2 - For these exercises, perform each of these steps....Ch. 9.2 - For these exercises, perform each of these steps....Ch. 9.2 - For these exercises, perform each of these steps....Ch. 9.2 - Prob. 9ECh. 9.2 - Find the 95% confidence interval for the...Ch. 9.2 - Prob. 11ECh. 9.2 - Prob. 12ECh. 9.2 - Prob. 13ECh. 9.2 - Prob. 14ECh. 9.2 - Prob. 15ECh. 9.2 - Ages of Homes Whiting, Indiana, leads the Top 100...Ch. 9.2 - Prob. 17ECh. 9.2 - Out-of-State Tuitions The out-of-state tuitions...Ch. 9.2 - Prob. 19ECh. 9.2 - For these exercises, perform each of these steps....Ch. 9.2 - Prob. 21ECh. 9.2 - Prob. 22ECh. 9.3 - Air Quality As a researcher for the EPA, you have...Ch. 9.3 - Classify each as independent or dependent samples....Ch. 9.3 - For Exercises 2 through 12, perform each of these...Ch. 9.3 - For Exercises 2 through 12, perform each of these...Ch. 9.3 - For Exercises 2 through 12, perform each of these...Ch. 9.3 - Prob. 5ECh. 9.3 - For Exercises 2 through 12, perform each of these...Ch. 9.3 - For Exercises 2 through 12, perform each of these...Ch. 9.3 - For Exercises 2 through 12, perform each of these...Ch. 9.3 - For Exercises 2 through 12, perform each of these...Ch. 9.3 - Toy Assembly Test An educational researcher...Ch. 9.3 - Prob. 11ECh. 9.3 - For Exercises 2 through 12, perform each of these...Ch. 9.3 - Prob. 13ECCh. 9.4 - Smoking and Education You are researching the...Ch. 9.4 - Prob. 1ECh. 9.4 - Find p and q for each. a. n = 36, X = 20 b. n =...Ch. 9.4 - Prob. 3ECh. 9.4 - Find each X, given p. a. p = 0.24, n = 300 b. p =...Ch. 9.4 - Prob. 5ECh. 9.4 - Find p and q. a. X1 = 6, n1 = 15, X2 = 9, n2 = 15...Ch. 9.4 - For Exercises 7 through 27, perform these steps....Ch. 9.4 - Prob. 8ECh. 9.4 - Prob. 9ECh. 9.4 - For Exercises 7 through 27, perform each of these...Ch. 9.4 - Prob. 11ECh. 9.4 - For Exercises 7 through 27, perform each of these...Ch. 9.4 - Prob. 13ECh. 9.4 - For Exercises 7 through 27, perform each of these...Ch. 9.4 - Prob. 15ECh. 9.4 - Smoking Survey National statistics show that 23%...Ch. 9.4 - For Exercises 7 through 27, perform each of these...Ch. 9.4 - For Exercises 7 through 27, perform each of these...Ch. 9.4 - Prob. 19ECh. 9.4 - For Exercises 7 through 27, perform these steps....Ch. 9.4 - For Exercises 7 through 27, perform these steps....Ch. 9.4 - For Exercises 7 through 27, perform these steps....Ch. 9.4 - For Exercises 7 through 27, perform these steps....Ch. 9.4 - For Exercises 7 through 27, perform these steps....Ch. 9.4 - For Exercises 7 through 27, perform these steps....Ch. 9.4 - For Exercises 7 through 27, perform these steps....Ch. 9.4 - For Exercises 7 through 27, perform these steps....Ch. 9.4 - Prob. 28ECCh. 9.5 - Prob. 1ACCh. 9.5 - When one is computing the F test value, what...Ch. 9.5 - Why is the critical region always on the right...Ch. 9.5 - What are the two different degrees of freedom...Ch. 9.5 - What are the characteristics of the F...Ch. 9.5 - Prob. 5ECh. 9.5 - Using Table H, find the critical value for each....Ch. 9.5 - Prob. 7ECh. 9.5 - Using Table H, find the P-value interval for each...Ch. 9.5 - Prob. 9ECh. 9.5 - For Exercises 9 through 24, perform the following...Ch. 9.5 - For Exercises 9 through 24, perform the following...Ch. 9.5 - For Exercises 9 through 24, perform the following...Ch. 9.5 - Prob. 13ECh. 9.5 - For Exercises 9 through 24, perform the following...Ch. 9.5 - For Exercises 9 through 24, perform the following...Ch. 9.5 - For Exercises 9 through 24, perform the following...Ch. 9.5 - Prob. 17ECh. 9.5 - For Exercises 9 through 24, perform the following...Ch. 9.5 - For Exercises 9 through 24, perform the following...Ch. 9.5 - For Exercises 9 through 24, perform the following...Ch. 9.5 - Prob. 21ECh. 9.5 - For Exercises 9 through 24, perform the following...Ch. 9.5 - Prob. 23ECh. 9.5 - For Exercises 9 through 24, perform the following...Ch. 9 - For each exercise, perform these steps. Assume...Ch. 9 - Prob. 9.1.2RECh. 9 - Prob. 9.2.3RECh. 9 - Prob. 9.2.4RECh. 9 - For each exercise, perform these steps. Assume...Ch. 9 - Prob. 9.2.6RECh. 9 - High and Low Temperatures March is a month of...Ch. 9 - Testing After Review A statistics class was given...Ch. 9 - Lay Teachers in Religious Schools A study found a...Ch. 9 - Prob. 9.4.10RECh. 9 - Prob. 9.5.11RECh. 9 - Heights of World Famous Cathedrals The heights (in...Ch. 9 - Prob. 9.5.13RECh. 9 - Prob. 1DACh. 9 - Prob. 2DACh. 9 - Prob. 3DACh. 9 - Prob. 4DACh. 9 - Prob. 5DACh. 9 - Prob. 1CQCh. 9 - Prob. 2CQCh. 9 - Prob. 3CQCh. 9 - Prob. 4CQCh. 9 - Prob. 5CQCh. 9 - To test the equality of two proportions, you would...Ch. 9 - Prob. 7CQCh. 9 - Prob. 8CQCh. 9 - Complete these statements with the best answer. 9....Ch. 9 - Prob. 10CQCh. 9 - Prob. 11CQCh. 9 - Prob. 12CQCh. 9 - Prob. 13CQCh. 9 - Prob. 14CQCh. 9 - Prob. 15CQCh. 9 - Prob. 16CQCh. 9 - For these exercises, perform each of these steps....Ch. 9 - Prob. 18CQCh. 9 - Prob. 19CQCh. 9 - Mathematical Skills In an effort to improve the...Ch. 9 - Prob. 21CQCh. 9 - Prob. 22CQCh. 9 - Prob. 23CQCh. 9 - Prob. 24CQCh. 9 - Prob. 25CQ
Knowledge Booster
Background pattern image
Statistics
Learn more about
Need a deep-dive on the concept behind this application? Look no further. Learn more about this topic, statistics and related others by exploring similar questions and additional content below.
Recommended textbooks for you
Text book image
MATLAB: An Introduction with Applications
Statistics
ISBN:9781119256830
Author:Amos Gilat
Publisher:John Wiley & Sons Inc
Text book image
Probability and Statistics for Engineering and th...
Statistics
ISBN:9781305251809
Author:Jay L. Devore
Publisher:Cengage Learning
Text book image
Statistics for The Behavioral Sciences (MindTap C...
Statistics
ISBN:9781305504912
Author:Frederick J Gravetter, Larry B. Wallnau
Publisher:Cengage Learning
Text book image
Elementary Statistics: Picturing the World (7th E...
Statistics
ISBN:9780134683416
Author:Ron Larson, Betsy Farber
Publisher:PEARSON
Text book image
The Basic Practice of Statistics
Statistics
ISBN:9781319042578
Author:David S. Moore, William I. Notz, Michael A. Fligner
Publisher:W. H. Freeman
Text book image
Introduction to the Practice of Statistics
Statistics
ISBN:9781319013387
Author:David S. Moore, George P. McCabe, Bruce A. Craig
Publisher:W. H. Freeman
Hypothesis Testing using Confidence Interval Approach; Author: BUM2413 Applied Statistics UMP;https://www.youtube.com/watch?v=Hq1l3e9pLyY;License: Standard YouTube License, CC-BY
Hypothesis Testing - Difference of Two Means - Student's -Distribution & Normal Distribution; Author: The Organic Chemistry Tutor;https://www.youtube.com/watch?v=UcZwyzwWU7o;License: Standard Youtube License