
Concept explainers
Videos
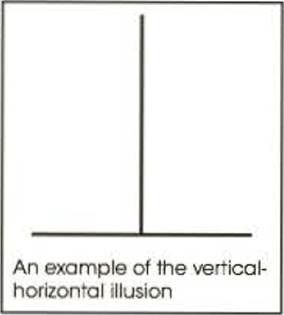
An example of the vertical-horizontal illusion is shown in the figure. Although the two lines are exactly the same length, the vertical line appears to be much longer. To examine the strength of this illusion, a researcher prepared an example in which both lines were exactly 10 inches long. The example was shown to individual participants who were told that the horizontal line was 10 inches long and then were asked to estimate the length of the vertical line. For a sample of n = 25 participants, the average estimate was M = 12.2 inches with a standard deviation of s = 1.00.
a. Use a one-tailed hypothesis test with α = .01 to demonstrate that the individuals in the sample significantly overestimate the true length of the line. (Note: Accurate estimation would produce a mean of μ - 10 inches.)
b. Calculate the estimated d and r2, the percentage of variance accounted for, to measure the size of this effect.
c. Construct a 95% confidence interval for the population mean estimated length of the vertical line.

Trending nowThis is a popular solution!

Chapter 9 Solutions
Essentials of Statistics for The Behavioral Sciences (MindTap Course List)


- Use theorem 5.4.3 to form a proportion in which TS is a geometric mean. Hint: TVSTSR Exercises 1-6arrow_forwardAnswer the following questions. 5. What is the term for the arrangement that selects r objects from a set of ii objects when the order of the r objects is not important? What is the formula for calculating the number of possible outcomes for this type of arrangement?arrow_forwardUse theorem 5.4.3 to form a proportion in which RS is a geometric mean. Hint RVSRST Exercises 1-6arrow_forward

 Big Ideas Math A Bridge To Success Algebra 1: Stu...AlgebraISBN:9781680331141Author:HOUGHTON MIFFLIN HARCOURTPublisher:Houghton Mifflin Harcourt
 Elementary Geometry For College Students, 7eGeometryISBN:9781337614085Author:Alexander, Daniel C.; Koeberlein, Geralyn M.Publisher:Cengage,
 Glencoe Algebra 1, Student Edition, 9780079039897...AlgebraISBN:9780079039897Author:CarterPublisher:McGraw Hill