UNDERSTANDING BASIC STAT LL BUND >A< F
7th Edition
ISBN: 9781337372763
Author: BRASE
Publisher: Cengage Learning
bartleby

Videos

Textbook Question
Book Icon
Chapter 9, Problem 8CRP

In Problems 8-12, please use the following steps (i)-(v) for all hypothesis tests:

(i) What is the level of significance? State the null and alternate hypotheses.

(ii) Check Requirements What sampling distribution will you use? What assumptions are you making? What is the value of the sample test statistic?

(iii) Find (or estimate) the P-value. Sketch the sampling distribution and show the area corresponding to the P-value.

(iv) Based on your answers in parts (i)-(iii), will you reject or fail to reject the null hypothesis? Are the data statistically significant at level a?

(v) Interpret your conclusion in the context of the application.

Note: For degrees of freedom d.f. not in the Student’s t table, use the closet d.f. that is smaller. In some situation, this choice of d.f. may increase the P-value a small amount and thereby produce a slightly more "conservative” answer.

Testing and Estimating µ with σ Known Let x be a random variable that represents micrograms of lead per liter of water (µg/L). An industrial plant discharges water into a creek. The Environmental Protection Agency has studied the discharged water and found x to have a normal distribution, with σ = 0.7 µg/L (Reference: EPA Wet lands Case Studies).

(a) The industrial plant says that the population mean value of x is µ = 2.0 µg/L. However. A random sample of n = 10 water samples showed that x ¯ = 2.56 μ g/L . Does this indicate that the lead-concentration population mean is higher than the industrial plant claims? Use α = 1%.

(b) Find a 95% confidence interval for µ using the sample data and the EPA value for σ.

(e) How large a sample should be taken to be 95% confident that the sample mean x ¯ is within a margin of error E = 0.2 µg/L of the population mean?

(a)

(i)

Expert Solution
Check Mark
To determine

The level of significance, null and alternative hypothesis.

Answer to Problem 8CRP

Solution: The level of significance is α=0.01. The null hypothesis is H0:μ=2.0 and alternative hypothesis H1:μ>2.0.

Explanation of Solution

The level of significance is defined as the probability of rejecting the null hypothesis when it is true, it is denoted by α=0.01.

Null hypothesis H0:μ=2.0

Alternative hypothesis H1:μ>2.0

(ii)

Expert Solution
Check Mark
To determine

To find: The sampling distribution that should be used and compute the value of the sample test statistic.

Answer to Problem 8CRP

Solution: The normal distributionshould be used. The sample test statisticis 2.53.

Explanation of Solution

Calculation:

We will use the normal distribution because the original distribution x is normal and also σ is known.

Using x¯=2.56,μx¯=2,σ=0.7,n=10

The sample test statistic z is

z=x¯μx¯σnz=2.5620.710z=2.5298z2.53

(iii)

Expert Solution
Check Mark
To determine

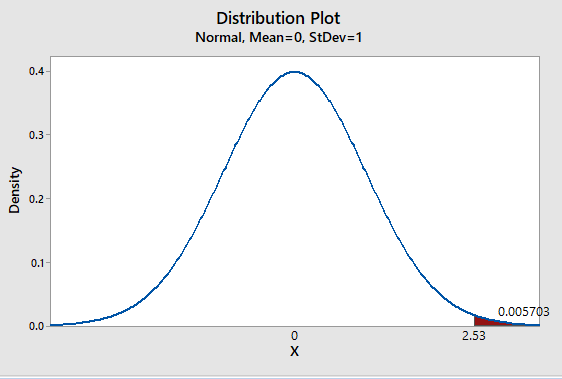
To find: The P-value of the test statistic and sketch the sampling distribution showing the area corresponding to the P-value.

Answer to Problem 8CRP

Solution: The P-value of the test statistic is 0.0057.

Explanation of Solution

Calculation:

We have z = 2.53

Pvalue=P(z>2.53)=1P(z2.53)Using Table 3 from the Appendix to find the specified area:=10.9943=0.0057

Graph:

To draw the required graphs using the Minitab, follow the below instructions:

To draw the required graphs using the Minitab, follow the below instructions:

Step 1: Go to the Minitab software.

Step 2: Go to Graph > Probability distribution plot > View probability.

Step 3: Select ‘Normal’ and Mean = 0, Standard deviation = 1.

Step 4: Click on the Shaded area > X value.

Step 5: Enter X-value as 2.53 and select ‘Right Tail’.

Step 6: Click on OK.

The obtained distribution graph is:

UNDERSTANDING BASIC STAT LL BUND >A< F, Chapter 9, Problem 8CRP

Pvalue=0.0057

(iv)

Expert Solution
Check Mark
To determine

Whether we reject or fail to reject the null hypothesisand whether the data is statistically significant for a level of significance of 0.01.

Answer to Problem 8CRP

Solution: The P-value < α, hence we will reject the H0. The data isstatistically significant for a level of significance of 0.01.

Explanation of Solution

The P-value of 0.0057 is less than the level of significance (α) of 0.01. Therefore we have to reject the null hypothesis H0, hence the data is statistically significant for a level of significance of 0.01.

(v)

Expert Solution
Check Mark
To determine

The interpretation for the conclusion.

Answer to Problem 8CRP

Solution: There is enough evidence to conclude that lead concentration population average is higher than the industrial plant claims.

Explanation of Solution

The P-value of 0.0057 is less than the level of significance (α) of 0.01. Therefore we have to reject the null hypothesis H0. There is enough evidence to conclude that lead concentration population average is higher than the industrial plant claims

(b)

Expert Solution
Check Mark
To determine

To find: A 95% confidence interval for the mean using the sample data.

Answer to Problem 8CRP

Solution:

The 95% confidence interval for μ is (2.13, 2.99).

Explanation of Solution

Calculation:

We have to find 95% confidence interval

σ=0.7n=10UsingTable3ofAppendixzc=1.96E=zcσnE=1.960.710E=0.434

95% confidence interval is

x¯E<μ<x¯+E2.560.434<μ<2.56+0.4342.13<μ<2.99

The 95% confidence interval for μ is (2.13, 2.99).

(c)

Expert Solution
Check Mark
To determine

To find: The minimum sample size so that the margin of error is not more than 0.2 μg/L.

Answer to Problem 8CRP

Solution:

The sample size is 48 so that the margin of error is not more than 0.2 μg/L.

Explanation of Solution

Calculation:

We have the sample size formula as follows

n=(zcσE)2σ=0.7E=0.2UsingTable3ofAppendixzc=1.96

n=(zcσE)2n=[(1.96)(0.7)0.2]2n=47.05n48

Therefore n = 48 is the minimum sample size to ensure that the margin of error E is not more than 0.2 μg/L.

Want to see more full solutions like this?

Subscribe now to access step-by-step solutions to millions of textbook problems written by subject matter experts!

Chapter 9 Solutions

UNDERSTANDING BASIC STAT LL BUND >A< F

Ch. 9.1 - Basic Computation: Setting Hypotheses Suppose you...Ch. 9.1 - Basic Computation: Setting Hypotheses Suppose you...Ch. 9.1 - Prob. 13PCh. 9.1 - Basic Computation: Find the Test Statistic....Ch. 9.1 - Veterinary Science: Colts The body weight of a...Ch. 9.1 - Marketing: Shopping Time How much customers buy is...Ch. 9.1 - Meteorology: StormsWeatherwise magazine is...Ch. 9.1 - Prob. 18PCh. 9.1 - For Problems 19-24, please provide the following...Ch. 9.1 - For Problems 19-24, please provide the following...Ch. 9.1 - For Problems 19-24, please provide the following...Ch. 9.1 - For Problems 19-24, please provide the following...Ch. 9.1 - For Problems 19-24, please provide the following...Ch. 9.1 - For Problems 19-24, please provide the following...Ch. 9.2 - Statistical Literacy For the same sample data and...Ch. 9.2 - Statistical Literacy To test for an x...Ch. 9.2 - Statistical Literacy When using the Students t...Ch. 9.2 - Critical Thinking Consider a test for . If the...Ch. 9.2 - Critical Thinking Consider a test for .If the...Ch. 9.2 - Critical Thinking If sample data is such that for...Ch. 9.2 - Basic Computation: P-value Corresponding to t...Ch. 9.2 - Basic Computation: P-value Corresponding to t...Ch. 9.2 - Basic Computation: Testing , Unknown A random...Ch. 9.2 - Basic Computation: Testing , Unknown A random...Ch. 9.2 - (c) Find (or estimate) the P-value. Sketch the...Ch. 9.2 - Please provide the following information for...Ch. 9.2 - Please provide the following information for...Ch. 9.2 - Please provide the following information for...Ch. 9.2 - Please provide the following information for...Ch. 9.2 - Please provide the following information for...Ch. 9.2 - Please provide the following information for...Ch. 9.2 - Please provide the following information for...Ch. 9.2 - Please provide the following information for...Ch. 9.2 - Please provide the following information for...Ch. 9.2 - Please provide the following information for...Ch. 9.2 - Please provide the following information for...Ch. 9.2 - Critical Thinking: One-Tailed versus Two-Tailed...Ch. 9.2 - Expand Your Knowledge: Two Confidence Intervals...Ch. 9.2 - Prob. 25PCh. 9.2 - Prob. 26PCh. 9.2 - Prob. 27PCh. 9.2 - Prob. 28PCh. 9.2 - Critical Region Method: Student'st Solve Problem...Ch. 9.2 - Critical Region Method: Student'st Solve Problem...Ch. 9.3 - Terminology Answer true or false. The margin of...Ch. 9.3 - Prob. 2PCh. 9.3 - Prob. 3PCh. 9.3 - Terminology Answer true or false. The margin of...Ch. 9.3 - Basic Computation: Testingp A random sample of 30...Ch. 9.3 - Basic Computation: Testingp A random sample of 60...Ch. 9.3 - For Problems 7-21, please provide the following...Ch. 9.3 - For Problems 7-21, please provide the following...Ch. 9.3 - For Problems 7-21. please provide the following...Ch. 9.3 - For Problems 7-21. please provide the following...Ch. 9.3 - For Problems 7-21, please provide the following...Ch. 9.3 - For Problems 7-21. please provide the following...Ch. 9.3 - For Problems 7-21, please provide the following...Ch. 9.3 - For Problems 7-21, please provide the following...Ch. 9.3 - For Problems 7-21. please provide the following...Ch. 9.3 - For Problems 7-21, please provide the following...Ch. 9.3 - For Problems 7-21. please provide the following...Ch. 9.3 - For Problems 7-21, please provide the following...Ch. 9.3 - For Problems 721, please provide the following...Ch. 9.3 - For Problems 721, please provide the following...Ch. 9.3 - For Problems 721, please provide the following...Ch. 9.3 - Critical Region Method: Testing Proportions Solve...Ch. 9.3 - Prob. 23PCh. 9.3 - Prob. 24PCh. 9 - Statistical Literacy When testing how do we...Ch. 9 - Statistical Literacy What do we mean when we say a...Ch. 9 - Critical Thinking All other conditions being...Ch. 9 - Critical Thinking All other conditions being...Ch. 9 - Vehicles: Mileage Based on information in...Ch. 9 - Before you solve each problem below, first...Ch. 9 - Before you solve each problem below, first...Ch. 9 - Before you solve each problem below, first...Ch. 9 - Before you solve each problem below, first...Ch. 9 - Prob. 10CRCh. 9 - Before you solve each problem below, first...Ch. 9 - Before you solve each problem below, first...Ch. 9 - Prob. 1DHGPCh. 9 - Prob. 1LCWPCh. 9 - Prob. 2LCWPCh. 9 - The following statements are very important. Give...Ch. 9 - Prob. 4LCWPCh. 9 - As access to computers becomes more and more...Ch. 9 - Prob. 1CRPCh. 9 - Prob. 2CRPCh. 9 - Statistical Literacy Please give a careful but...Ch. 9 - Prob. 4CRPCh. 9 - Normal Approximation to the Binomial the majority...Ch. 9 - Prob. 6CRPCh. 9 - Sampling Distribution p Do you have a great deal...Ch. 9 - In Problems 8-12, please use the following steps...Ch. 9 - In Problems 8-12, please use the following steps...Ch. 9 - Prob. 10CRPCh. 9 - In Problems 8-12, please use the following steps...Ch. 9 - In Problems 8-12, please use the following steps...
Knowledge Booster
Background pattern image
Statistics
Learn more about
Need a deep-dive on the concept behind this application? Look no further. Learn more about this topic, statistics and related others by exploring similar questions and additional content below.
Recommended textbooks for you
Text book image
MATLAB: An Introduction with Applications
Statistics
ISBN:9781119256830
Author:Amos Gilat
Publisher:John Wiley & Sons Inc
Text book image
Probability and Statistics for Engineering and th...
Statistics
ISBN:9781305251809
Author:Jay L. Devore
Publisher:Cengage Learning
Text book image
Statistics for The Behavioral Sciences (MindTap C...
Statistics
ISBN:9781305504912
Author:Frederick J Gravetter, Larry B. Wallnau
Publisher:Cengage Learning
Text book image
Elementary Statistics: Picturing the World (7th E...
Statistics
ISBN:9780134683416
Author:Ron Larson, Betsy Farber
Publisher:PEARSON
Text book image
The Basic Practice of Statistics
Statistics
ISBN:9781319042578
Author:David S. Moore, William I. Notz, Michael A. Fligner
Publisher:W. H. Freeman
Text book image
Introduction to the Practice of Statistics
Statistics
ISBN:9781319013387
Author:David S. Moore, George P. McCabe, Bruce A. Craig
Publisher:W. H. Freeman
What Are Research Ethics?; Author: HighSchoolScience101;https://www.youtube.com/watch?v=nX4c3V23DZI;License: Standard YouTube License, CC-BY
What is Ethics in Research - ethics in research (research ethics); Author: Chee-Onn Leong;https://www.youtube.com/watch?v=W8Vk0sXtMGU;License: Standard YouTube License, CC-BY