
Concept explainers
Videos
(a)
To Explain: the P-value.
(a)
Answer to Problem R9.7RE
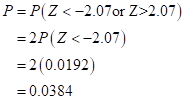
There is a 0.0384 probability that get 31 successes among 50 trials or more extreme, when the roulette wheel is fair.
Explanation of Solution
Given:

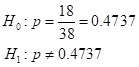
Given claim: Roulette wheel is fair and therefore the ball lends in a read slot 18 times out of 38 on average.
The claim is either the null hypothesis or the alternative hypothesis. The null hypotheses statement is that the population mean is equal to the value given in the claim. If the null hypothesis is the claim then the alternative hypothesis statement is the opposite of null hypothesis.

The P-value is the probability of getting the value of the test statistic or a value more extreme, when the null hypothesis is true.
There is a 0.0384 probability that get 31 successes among 50 trials or more extreme, when the roulette wheel is fair.
(b)
To Explain: the conclusion would make at the  level.
(b)
Answer to Problem R9.7RE
There is enough convincing proof that the American roulette wheel is not fair.
Explanation of Solution
Given:

Given claim is that the proportion is 18 out of every 38
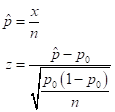
Formula used:
Calculation:
The claim is either the null hypothesis or the alternative hypothesis. The null hypotheses statement is that the population mean is equal to the value given in the claim. If the null hypothesis is the claim then the alternative hypothesis statement is the opposite of null hypothesis.
Conditions
The three conditions are: Random, independent, Normal (large counts)
Random: Satisfied, because it is safe to assume that the different spins of the wheel are random.
Independent: satisfied, the reason is that the sample of 50 spins is less than 10% of the population of all spins (assuming that there are more than 500 spins with the roulette wheel).
Normal: Satisfied, because
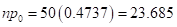 and
and  are both at least 10.
Since all condition are satisfied, it is suitable to use a hypothesis test for the population proportion
Hypothesis test
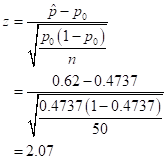
The sample proportion is
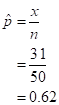
The test- statistic is
The P-value is the probability of getting the value of the test statistic, or a value more extreme, when the null hypothesis is true. Find the P-value using the normal probability table
If the P-value is lesser than the significance level then reject the null hypothesis:
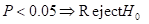
There is enough convincing proof that the American roulette wheel is not fair.
(c)
To Explain: the responses on the basis of given data.
(c)
Answer to Problem R9.7RE
Researcher is correct
Explanation of Solution
Given:
99% confidence level: (0.44, 0.80)

The Researcher is correct.
A 99% confidence interval associates with a significance test at the  level.
A 95% confidence interval associates with a significance test at the  level.
The significance test at the  level and therefore the associating 95% confidence interval, would lead to the opposite conclusion. Thus the there is not enough convincing evidence.
Chapter 9 Solutions
PRACTICE OF STATISTICS F/AP EXAM
Additional Math Textbook Solutions
Intro Stats, Books a la Carte Edition (5th Edition)
Essentials of Statistics (6th Edition)
Basic Business Statistics, Student Value Edition (13th Edition)
Introductory Statistics (10th Edition)


 MATLAB: An Introduction with ApplicationsStatisticsISBN:9781119256830Author:Amos GilatPublisher:John Wiley & Sons Inc
 Probability and Statistics for Engineering and th...StatisticsISBN:9781305251809Author:Jay L. DevorePublisher:Cengage Learning
 Statistics for The Behavioral Sciences (MindTap C...StatisticsISBN:9781305504912Author:Frederick J Gravetter, Larry B. WallnauPublisher:Cengage Learning
 Elementary Statistics: Picturing the World (7th E...StatisticsISBN:9780134683416Author:Ron Larson, Betsy FarberPublisher:PEARSON
 The Basic Practice of StatisticsStatisticsISBN:9781319042578Author:David S. Moore, William I. Notz, Michael A. FlignerPublisher:W. H. Freeman
 Introduction to the Practice of StatisticsStatisticsISBN:9781319013387Author:David S. Moore, George P. McCabe, Bruce A. CraigPublisher:W. H. Freeman