ESSENTIAL STATISTICS(FD)
18th Edition
ISBN: 9781260188097
Author: Navidi
Publisher: McGraw-Hill Publishing Co.
bartleby

Concept explainers

bartleby

Videos

Question
Book Icon
Chapter 9.1, Problem 4CYU

a.

To determine

Find the value of t-test statistic.

a.

Expert Solution
Check Mark

Answer to Problem 4CYU

The value of t-test statistic is 1.651768.

Explanation of Solution

Calculation:

The given statistics for testing the hypothesis H0:μ1=μ2 versus H1:μ1μ2 are given as follows:

x¯1=73.9, x¯2=71.8, s1=4.2, s2=3.8, n1=23 and n2=17.

Requirements for a small sample t-test:

  • The samples must be independent and drawn randomly from the populations.
  • Either the sample size must be greater than 30 or the population must be approximately normal.

Here, it is given that independent random samples are drawn from approximately normal populations.

Thus, the conditions are satisfied.

The hypotheses are given below:

Null hypothesis:

H0:μ1=μ2

Alternate hypothesis:

H1:μ1μ2

The test statistic for the small sample t is obtained as follows:

t=(x¯1x¯2)(μ1μ2)s12n1+s22n2

Under the null hypothesis, (μ1μ2)=0.

Therefore the test statistic is,

t=(x¯1x¯2)0s12n1+s22n2=73.971.84.2223+3.8217=2.11.271365=1.651768

Thus, the test statistic is 1.651768.

b.

To determine

Find the number of degrees of freedom for the test statistic.

b.

Expert Solution
Check Mark

Answer to Problem 4CYU

The number of degrees of freedom for the test statistic is 16.

Explanation of Solution

Calculation:

Degrees of freedom:

The degrees of freedom for t using computer package is,

Δ=[(s12n1+s22n2)]2(s12n1)2n11+(s22n2)2n21

The degrees of freedom, when computing by hand is smaller of n11 and n21.

The degrees of freedom is,

d.f=min(n11,n21)=min(231,171)=min(22,16)=16

Thus, the degree of freedom is 16.

c.

To determine

Find the P-value.

c.

Expert Solution
Check Mark

Answer to Problem 4CYU

The P-value is 0.11806.

Explanation of Solution

Calculation:

P-value:

Step-by-step procedure to obtain the P-value using the MINITAB software:

  • Choose Graph > Probability Distribution Plot.
  • Choose View Probability > OK.
  • From Distribution, choose‘t’ distribution.
  • In Degrees of freedom, enter 16.
  • Click the Shaded Area tab.
  • Choose X value and Both Tail for the region of the curve to shade.
  • In X-value enter 1.651768.
  • Click OK.

Output using the MINITAB software is given below:

ESSENTIAL STATISTICS(FD), Chapter 9.1, Problem 4CYU

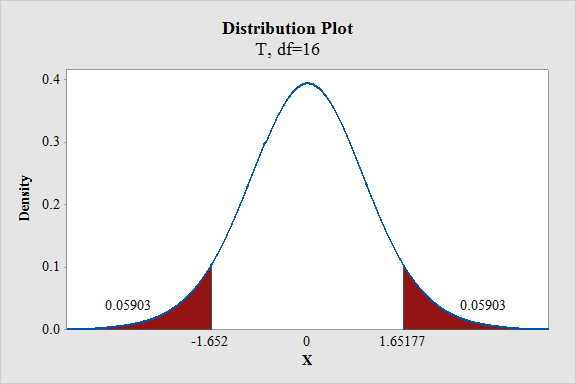
From the MINITAB output, the P-value is 0.05903×2=0.11806

Thus, the P-value is 0.11806.

d.

To determine

Interpret the P-value.

Check whether the null hypothesis is rejected at α=0.05.

d.

Expert Solution
Check Mark

Answer to Problem 4CYU

There is not enough evidence to reject the null hypothesis at α=0.05.

Explanation of Solution

Decision rule based on P-value:

If Pvalueα, then reject the null hypothesis H0.

If Pvalue>α, then fail to reject the null hypothesis H0.

Here, the level of significance is α=0.05.

Conclusion based on P-value approach:

The P-value is 0.11806 and α value is 0.05.

Here, P-value is greater than the α value.

That is 0.11806(=Pvalue)>0.05(=α).

By the rejection rule, failed to reject the null hypothesis.

Hence, the null hypothesis cannot be rejected at α=0.05.

Thus, it can be concluded that there is sufficient evidence to infer the equality of two population means at α=0.05_.

Want to see more full solutions like this?

Subscribe now to access step-by-step solutions to millions of textbook problems written by subject matter experts!

Chapter 9 Solutions

ESSENTIAL STATISTICS(FD)

Ch. 9.1 - Prob. 11ECh. 9.1 - Prob. 12ECh. 9.1 - Prob. 13ECh. 9.1 - Prob. 14ECh. 9.1 - Prob. 15ECh. 9.1 - Prob. 16ECh. 9.1 - Prob. 17ECh. 9.1 - Prob. 18ECh. 9.1 - Prob. 19ECh. 9.1 - Prob. 20ECh. 9.1 - Prob. 21ECh. 9.1 - Prob. 22ECh. 9.1 - Prob. 23ECh. 9.1 - Prob. 24ECh. 9.1 - Prob. 25ECh. 9.1 - Prob. 26ECh. 9.1 - 27. Does this diet help? A group of 78 people...Ch. 9.1 - Prob. 28ECh. 9.1 - Prob. 29ECh. 9.1 - Prob. 30ECh. 9.1 - Prob. 31ECh. 9.1 - Prob. 32ECh. 9.1 - Prob. 33ECh. 9.1 - Prob. 34ECh. 9.1 - Prob. 35ECh. 9.1 - Prob. 36ECh. 9.1 - Prob. 37ECh. 9.1 - 38. Interpret calculator display: The following...Ch. 9.1 - Prob. 39ECh. 9.1 - Prob. 40ECh. 9.1 - Prob. 41ECh. 9.2 - Prob. 1CYUCh. 9.2 - Prob. 2CYUCh. 9.2 - Prob. 3CYUCh. 9.2 - Prob. 4CYUCh. 9.2 - Prob. 5ECh. 9.2 - Prob. 6ECh. 9.2 - Prob. 7ECh. 9.2 - Prob. 8ECh. 9.2 - Prob. 9ECh. 9.2 - Prob. 10ECh. 9.2 - Prob. 11ECh. 9.2 - Prob. 12ECh. 9.2 - Prob. 13ECh. 9.2 - Prob. 14ECh. 9.2 - Prob. 15ECh. 9.2 - Prob. 16ECh. 9.2 - Prob. 17ECh. 9.2 - Prob. 18ECh. 9.2 - Prob. 19ECh. 9.2 - Prob. 20ECh. 9.2 - Prob. 21ECh. 9.2 - Prob. 22ECh. 9.2 - Prob. 23ECh. 9.2 - Prob. 24ECh. 9.2 - Prob. 25ECh. 9.2 - Prob. 26ECh. 9.2 - Prob. 27ECh. 9.2 - Prob. 28ECh. 9.2 - Prob. 29ECh. 9.2 - Prob. 30ECh. 9.2 - Prob. 31ECh. 9.2 - Prob. 32ECh. 9.2 - Prob. 33ECh. 9.2 - Prob. 34ECh. 9.2 - Prob. 35ECh. 9.2 - Prob. 36ECh. 9.2 - Prob. 37ECh. 9.3 - Prob. 1CYUCh. 9.3 - Prob. 2CYUCh. 9.3 - Prob. 3CYUCh. 9.3 - Prob. 4CYUCh. 9.3 - Prob. 5ECh. 9.3 - Prob. 6ECh. 9.3 - Prob. 7ECh. 9.3 - Prob. 8ECh. 9.3 - Prob. 9ECh. 9.3 - Prob. 10ECh. 9.3 - Prob. 11ECh. 9.3 - Prob. 12ECh. 9.3 - Prob. 13ECh. 9.3 - Prob. 14ECh. 9.3 - Prob. 15ECh. 9.3 - SAT coaching: A sample of 32 students took a class...Ch. 9.3 - Prob. 17ECh. 9.3 - Prob. 18ECh. 9.3 - Prob. 19ECh. 9.3 - Tires and fuel economy: A tire manufacturer is...Ch. 9.3 - Prob. 21ECh. 9.3 - Prob. 22ECh. 9.3 - Prob. 23ECh. 9.3 - Prob. 24ECh. 9.3 - Prob. 25ECh. 9.3 - Prob. 26ECh. 9.3 - Prob. 27ECh. 9.3 - Prob. 28ECh. 9.3 - Prob. 29ECh. 9.3 - Prob. 30ECh. 9.3 - Advantage of matched pairs: Refer to Exercise...Ch. 9.3 - Prob. 32ECh. 9 - A sample of 15 weight litters is tested to see how...Ch. 9 - Prob. 2CQCh. 9 - Prob. 3CQCh. 9 - Prob. 4CQCh. 9 - Prob. 5CQCh. 9 - Prob. 6CQCh. 9 - Prob. 7CQCh. 9 - Prob. 8CQCh. 9 - Prob. 9CQCh. 9 - Prob. 10CQCh. 9 - Prob. 11CQCh. 9 - In a survey of 300 randomly selected female and...Ch. 9 - Prob. 13CQCh. 9 - Prob. 14CQCh. 9 - Prob. 15CQCh. 9 - Prob. 1RECh. 9 - Prob. 2RECh. 9 - Prob. 3RECh. 9 - Prob. 4RECh. 9 - Prob. 5RECh. 9 - Prob. 6RECh. 9 - Prob. 7RECh. 9 - Prob. 8RECh. 9 - Prob. 9RECh. 9 - Polling results: A simple random sample of 400...Ch. 9 - Treating bean plants: In a study to measure the...Ch. 9 - Prob. 12RECh. 9 - Prob. 13RECh. 9 - Prob. 14RECh. 9 - Prob. 15RECh. 9 - Prob. 1WAICh. 9 - Prob. 2WAICh. 9 - Describe the differences between performing a...Ch. 9 - Prob. 4WAICh. 9 - In what ways is the procedure for constructing a...Ch. 9 - Prob. 6WAICh. 9 - Prob. 7WAICh. 9 - Prob. 1CSCh. 9 - Prob. 2CSCh. 9 - Prob. 3CSCh. 9 - Prob. 4CSCh. 9 - Prob. 5CSCh. 9 - Prob. 6CS
Knowledge Booster
Background pattern image
Statistics
Learn more about
Need a deep-dive on the concept behind this application? Look no further. Learn more about this topic, statistics and related others by exploring similar questions and additional content below.
Recommended textbooks for you
Text book image
MATLAB: An Introduction with Applications
Statistics
ISBN:9781119256830
Author:Amos Gilat
Publisher:John Wiley & Sons Inc
Text book image
Probability and Statistics for Engineering and th...
Statistics
ISBN:9781305251809
Author:Jay L. Devore
Publisher:Cengage Learning
Text book image
Statistics for The Behavioral Sciences (MindTap C...
Statistics
ISBN:9781305504912
Author:Frederick J Gravetter, Larry B. Wallnau
Publisher:Cengage Learning
Text book image
Elementary Statistics: Picturing the World (7th E...
Statistics
ISBN:9780134683416
Author:Ron Larson, Betsy Farber
Publisher:PEARSON
Text book image
The Basic Practice of Statistics
Statistics
ISBN:9781319042578
Author:David S. Moore, William I. Notz, Michael A. Fligner
Publisher:W. H. Freeman
Text book image
Introduction to the Practice of Statistics
Statistics
ISBN:9781319013387
Author:David S. Moore, George P. McCabe, Bruce A. Craig
Publisher:W. H. Freeman
Statistics 4.1 Point Estimators; Author: Dr. Jack L. Jackson II;https://www.youtube.com/watch?v=2MrI0J8XCEE;License: Standard YouTube License, CC-BY
Statistics 101: Point Estimators; Author: Brandon Foltz;https://www.youtube.com/watch?v=4v41z3HwLaM;License: Standard YouTube License, CC-BY
Central limit theorem; Author: 365 Data Science;https://www.youtube.com/watch?v=b5xQmk9veZ4;License: Standard YouTube License, CC-BY
Point Estimate Definition & Example; Author: Prof. Essa;https://www.youtube.com/watch?v=OTVwtvQmSn0;License: Standard Youtube License
Point Estimation; Author: Vamsidhar Ambatipudi;https://www.youtube.com/watch?v=flqhlM2bZWc;License: Standard Youtube License